⚡ Installation
Get up and running in under a minute — no migration, no external setup required.
- Open Atlassian MarketplaceVisit the Marketplace listing and click Get it now.
- Select your Jira Cloud siteChoose the site where you want to install. You must be a Jira admin to install apps.
- Accept permissionsThe app requests read access to projects, boards, sprints, issues, and worklogs. Write access is only used for logging work (if applicable). No data leaves Atlassian's infrastructure.
- Open the appGo to Apps in the top navigation → Andreal Capacity Planner & Sprint Hub. The app is also accessible from any project's left sidebar under Apps.
Permissions Explained
| Permission | Why it's needed |
|---|---|
| read:jira-work | Read issues, estimates, time tracking, and worklogs |
| read:jira-user | Read assignee and team member information |
| read:project:jira | List your Jira projects |
| read:board-scope:jira-software | Access Scrum boards |
| read:sprint:jira-software | Access sprint data |
| write:jira-work | Used only when logging work or creating blockers from within the app |
| storage:app | Save sprint config, grooming sessions, retro boards per Jira site (Forge Storage) |
📍 Navigation
The top toolbar is your control center — select context and switch views from here.
Toolbar: Project → Board → Sprint dropdowns + Sprint Goal bar + view icons
Selecting Context
Always start by selecting from left to right: Project → Board → Sprint. The app remembers your last selection when you return.
- Project — lists all Jira projects you have access to
- Board — lists Scrum boards in the selected project
- Sprint — active sprint is shown first, labeled active. Completed sprints are available for historical review.
Sprint Goal Bar
When a sprint goal is set in Jira, it appears as a blue banner below the toolbar. Visible across all views as a constant reminder of what the team is working toward.
View Switcher Icons
| Icon | View | Primary Use |
|---|---|---|
| 📈 | Dashboard | Sprint health overview for daily standups & stakeholder updates |
| 📝 | Sprint Backlog | Full issue list during sprint execution |
| 📋 | Capacity Table | Workload balancing and capacity planning |
| 📑 | Sprint History | Post-sprint variance analysis |
| 👥 | Member Tasks | Quick view of who's doing what |
| 📅 | Gantt Chart | Time tracking visualization |
| ✍ | Grooming Space | Pre-sprint grooming sessions |
| 💬 | Daily Scrum | Daily standup facilitation |
| ⭐ | Sprint Review | End-of-sprint review with stakeholders |
| 🔄 | Retrospective | Team retrospective & action items |
| 👤 | My Sprint | Personal view — your own tasks & capacity |
| 📅 | Monthly Planning | All sprints in a month — utilization, velocity trend, member breakdown |
| 📊 | Quarterly Planning | All sprints in a quarter — Q1–Q4 navigation, cross-sprint breakdown |
| 🗺 | Roadmap | Gantt timeline for product roadmap planning with dependency arrows |
Refresh & Filter
The ↻ Refresh icon re-fetches data from Jira. Use this after making changes in Jira (closing issues, logging work) to see updated numbers. The 🔍 Filter icon opens the Smart Filters panel.
⚙ Sprint Configuration
Customize working hours, holidays, estimation mode, and per-member allocation for accurate capacity numbers.
Click the ⚙ gear icon in the toolbar to open the Sprint Configuration panel. Configuration is saved per sprint and per Jira site — changes here do not affect other sprints.
Sprint Configuration — Issue Types, Sprint Hours, and Per-Member Settings
Estimation Mode
Toggle between Hours and Story Points. In Hours mode, the app reads originalEstimate from Jira. In Story Points mode, it reads customfield_10016 (story points field).
The app auto-detects which issue types in your project use story points and shows a hint. You can override by selecting manually.
Issue Types
Select which issue types count toward capacity calculation. By default, Subtasks are used (recommended for teams that break stories into subtasks). You can include Stories, Tasks, or Bugs if your team estimates at that level.
Sprint Hours
- Hours / Day — standard working hours per person (e.g. 8). This is the baseline before leave and buffer.
- Working Days — toggle Mon–Sun. Non-working days are grayed out and excluded from total hours.
- Holidays — the calendar shows sprint days. Click any date to mark it as a holiday. Holidays are shared across all members for that sprint.
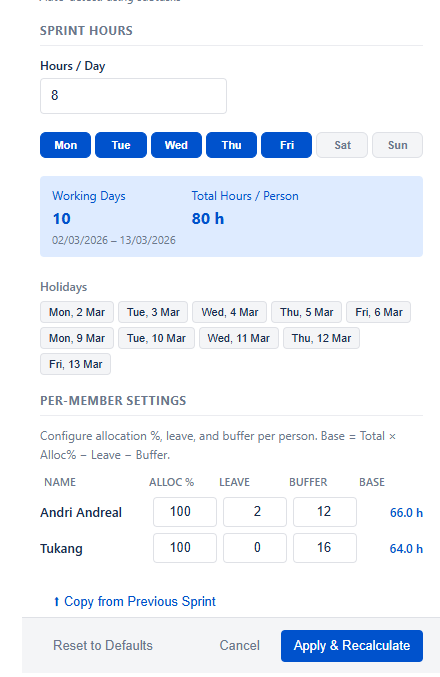
Per-member settings — adjust individually, see calculated Base hours in real-time
Per-Member Settings
| Field | Description | Example |
|---|---|---|
| Alloc % | What % of this sprint the member is allocated to this project. Useful for part-time contributors. | 50% = works half-time on this sprint |
| Leave | Hours this person is on leave during the sprint (sick leave, vacation, etc.) | 8h = 1 day off |
| Buffer | Hours reserved for non-sprint overhead: meetings, support, code reviews, admin. | 16h = 2 days buffer |
| Base | Auto-calculated available hours for sprint tasks. | See formula below |
Base = (Total Hours × Alloc%) − Leave − Buffer
// Example: 10 working days × 8h/day = 80h total
Base = (80h × 100%) − 8h leave − 16h buffer = 56h
Copy from Previous Sprint
Click ↑ Copy from Previous Sprint at the bottom of the config panel to pre-fill all per-member settings (Alloc %, Leave, Buffer) and working day configuration from the previous sprint. Holidays are not copied as they differ per sprint.
🔢 How Capacity is Calculated
Understanding the formulas behind every number in the app.
Core Formulas
Base Utilization = (Total Hours × Alloc%) − Leave − Buffer
Task Utilization = Σ originalEstimate of assigned issues
Balance % = (Task Utilization ÷ Base Utilization) × 100
// Team overall
Overall % = (Σ Task Utilization ÷ Σ Base Utilization) × 100
Delivery Rate = (Σ Done Task Hours ÷ Σ Total Task Hours) × 100
What "Task Utilization" counts
Task Utilization sums the originalEstimate (original time estimate) for all issues assigned to a member in the sprint — filtered by the issue types selected in Sprint Configuration. It does not use time spent or remaining estimate, so the number stays stable and represents what was planned.
In Progress & Done columns
| Column | What it counts |
|---|---|
| In Progress | Sum of originalEstimate for issues with status "In Progress" |
| Done | Sum of originalEstimate for issues with status "Done" (or any Done category) |
| Balance Utilization | Task Utilization − Done (remaining estimated work) |
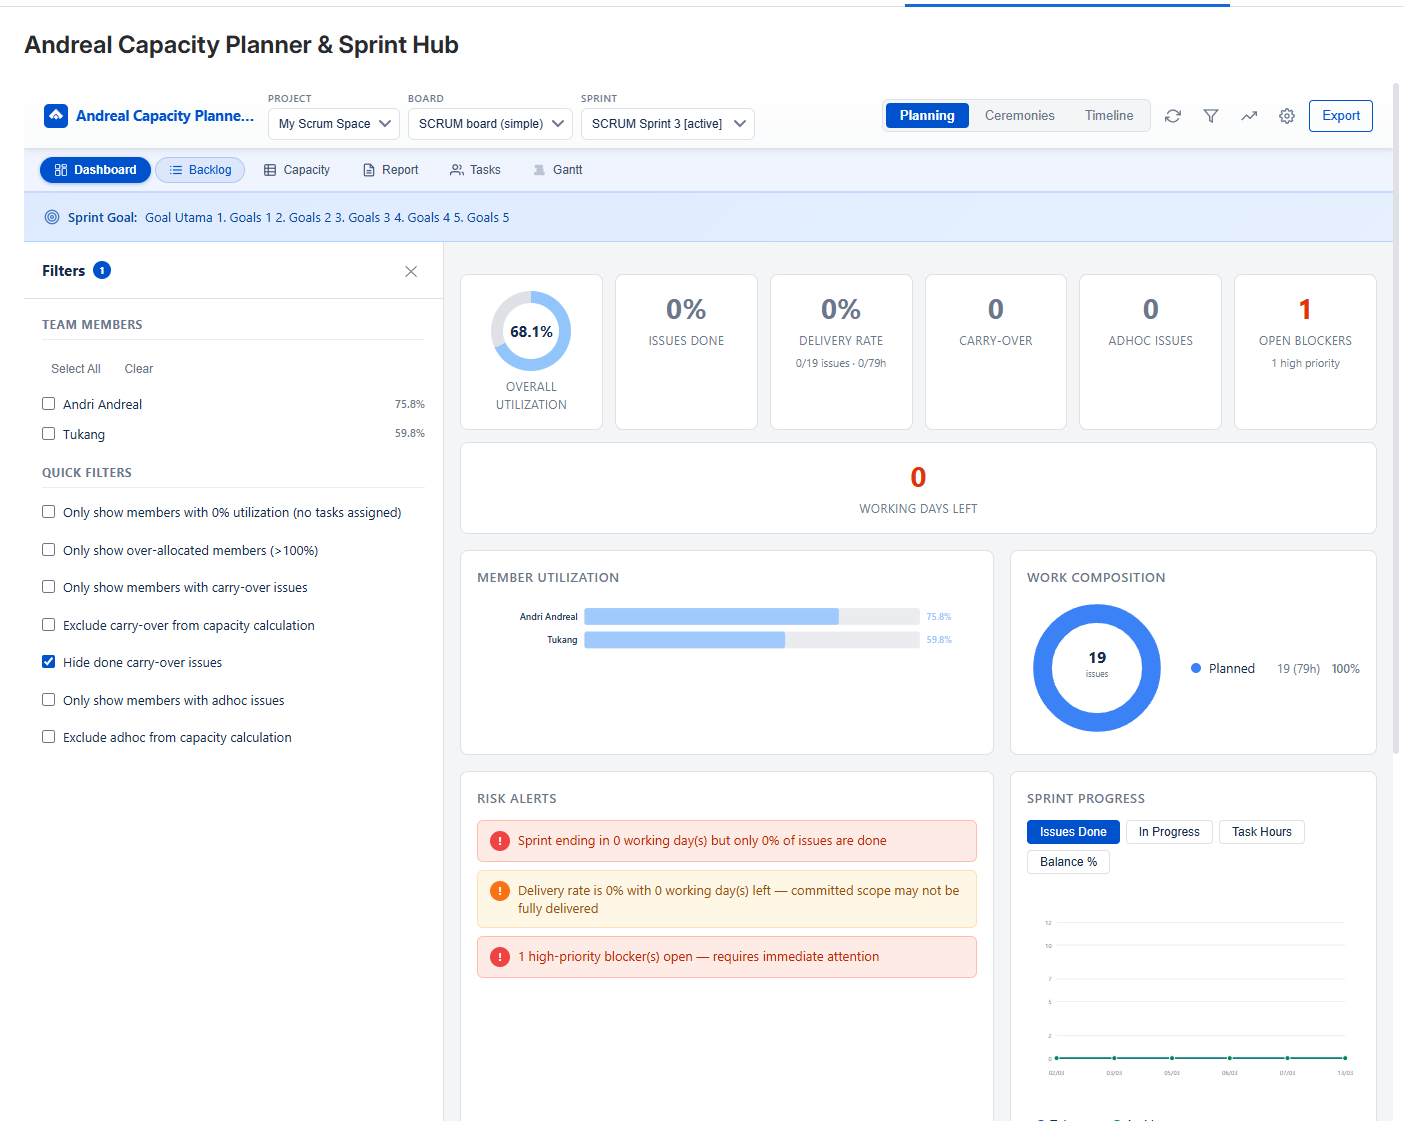
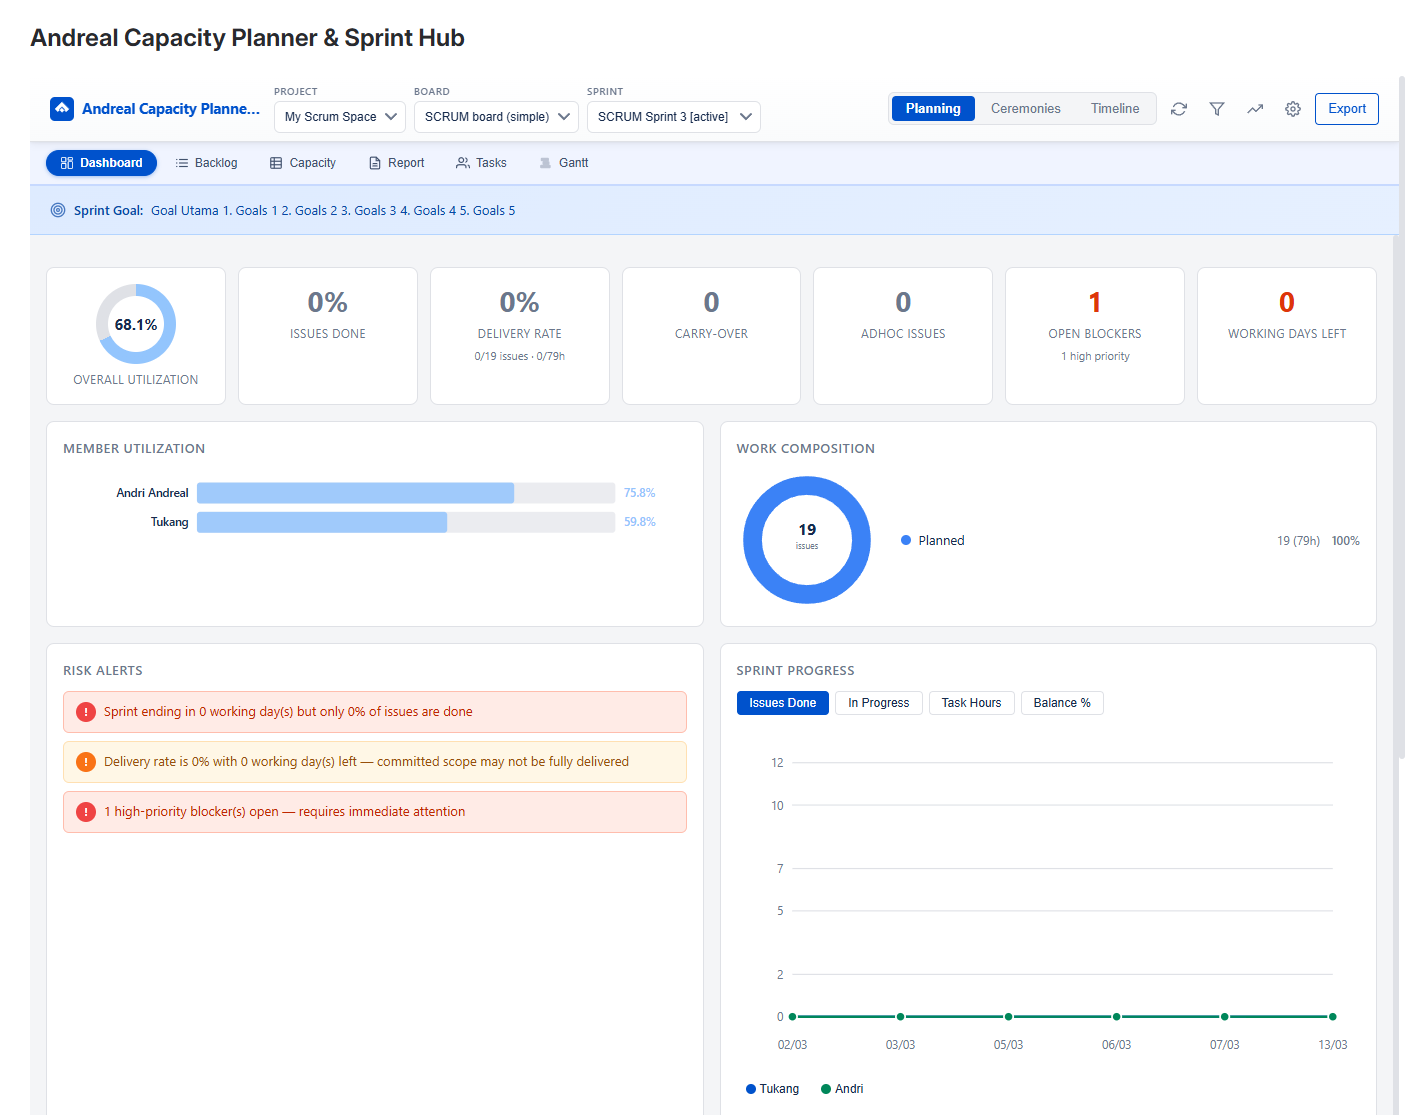
📈 Dashboard
Your sprint at a glance — key metrics, utilization chart, risk alerts, and progress trends. Best for daily standups and stakeholder updates.
Summary Cards (Top Row)
| Card | Formula / Source | When to act |
|---|---|---|
| Overall Utilization | Σ Task ÷ Σ Base × 100 — shown as a ring | Below 80% = team has spare capacity; above 110% = risk of overload |
| Issues Done % | Done issues ÷ Total sprint issues | Compare with days elapsed — should grow linearly |
| Delivery Rate | Done hours ÷ Committed hours | Below 50% mid-sprint = investigate blockers |
| Carry-Over | Issues from previous sprint still open/in this sprint | High carry-over = sprint planning needs adjustment |
| Adhoc Issues | Issues added after sprint start date | High adhoc = scope creep, protect sprint commitment |
| Open Blockers | Impediments marked as open in Sprint History | Resolve immediately — shown in red if high priority |
| Working Days Left | Remaining business days until sprint end date | Cross-reference with Done % to assess sprint health |
Member Utilization Chart
Horizontal bar chart showing each member's Balance % color-coded by utilization level. The vertical dashed line marks 100% (full capacity). Bars extending past the line indicate over-allocation.
Large team — 8 members, mixed utilization levels
Smaller team — Sprint Goal visible, Open Blockers card
Work Composition Donut
Shows the split between Planned (issues in sprint from the start) and Adhoc (added after sprint started) work by issue count and estimated hours. A healthy sprint has low adhoc percentage (<15%).
Risk Alerts
The app automatically surfaces warnings. These appear as red alert cards:
- Members over-allocated above 120%
- Members with 0% utilization (no tasks assigned)
- Adhoc ratio above 20% of total sprint hours
- Open high-priority blockers
- Sprint ending in <2 days with <70% issues done
Sprint Progress Chart
Multi-line trend chart with 4 views switchable via tabs:
- Issues Done — per-member cumulative done count over sprint days
- In Progress — in-progress issues per member over time
- Task Hours — estimated hours per member over time
- Balance % — how utilization changed per member daily
Below the chart, a data table shows the exact values for each date.
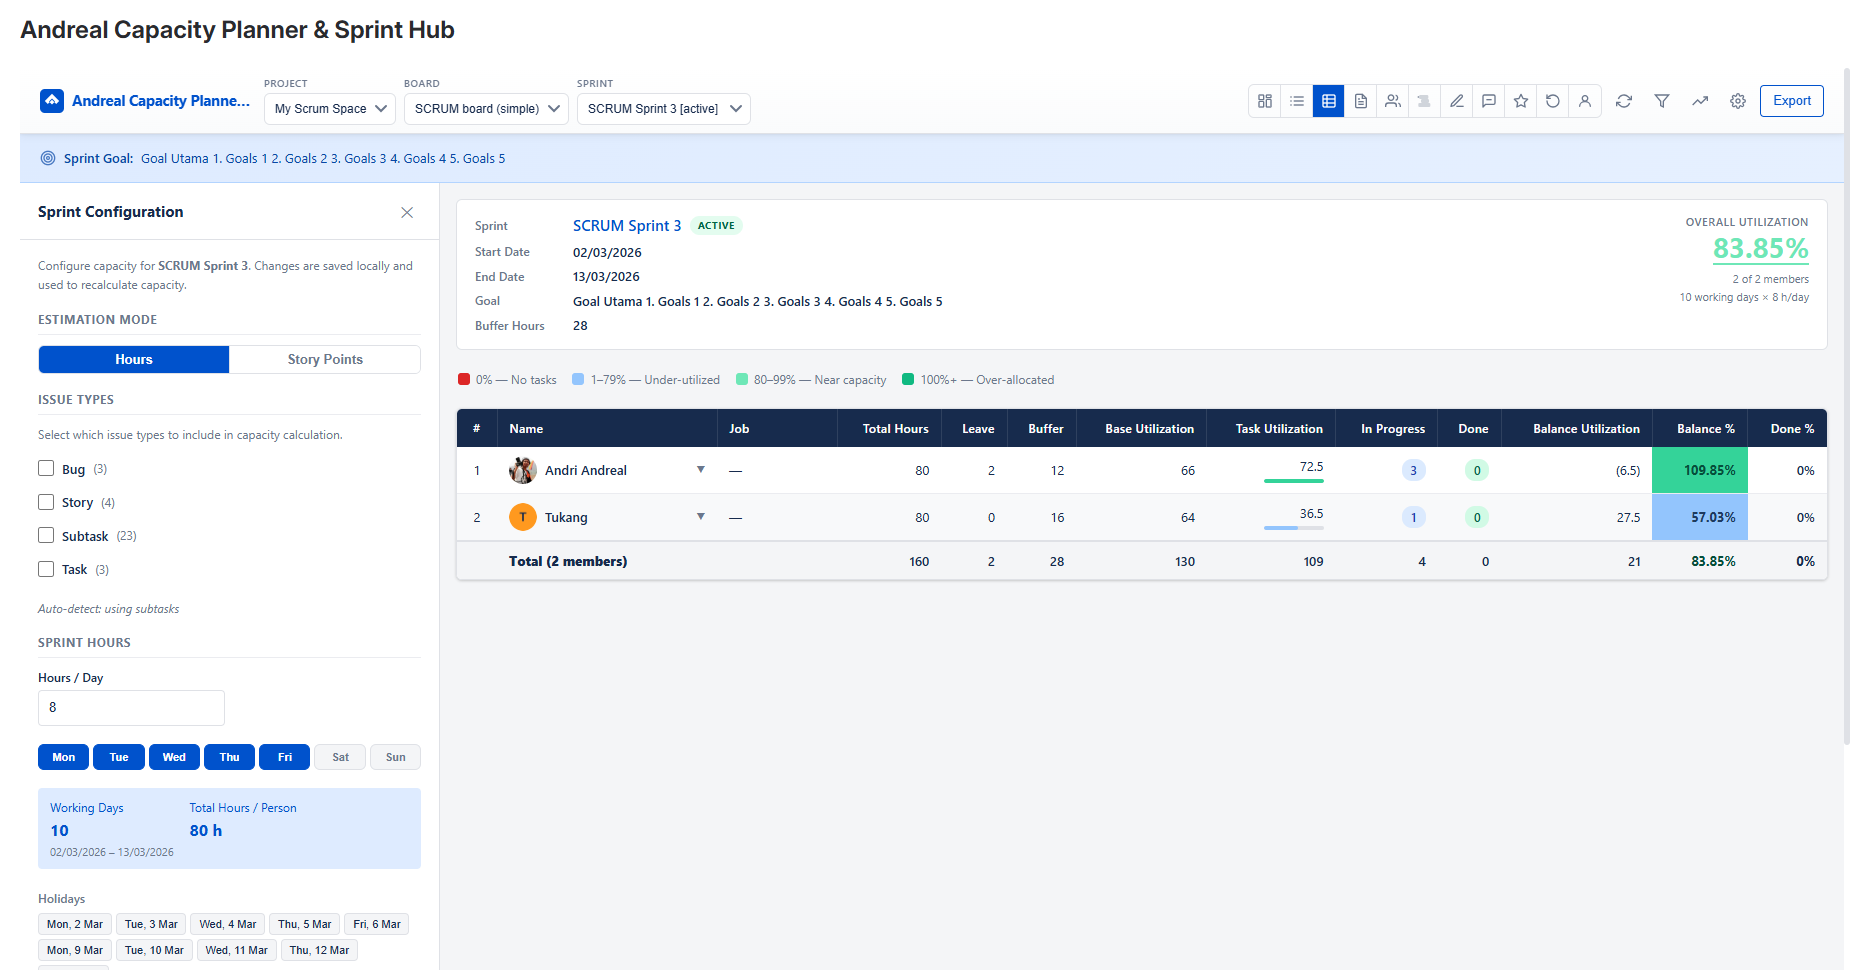
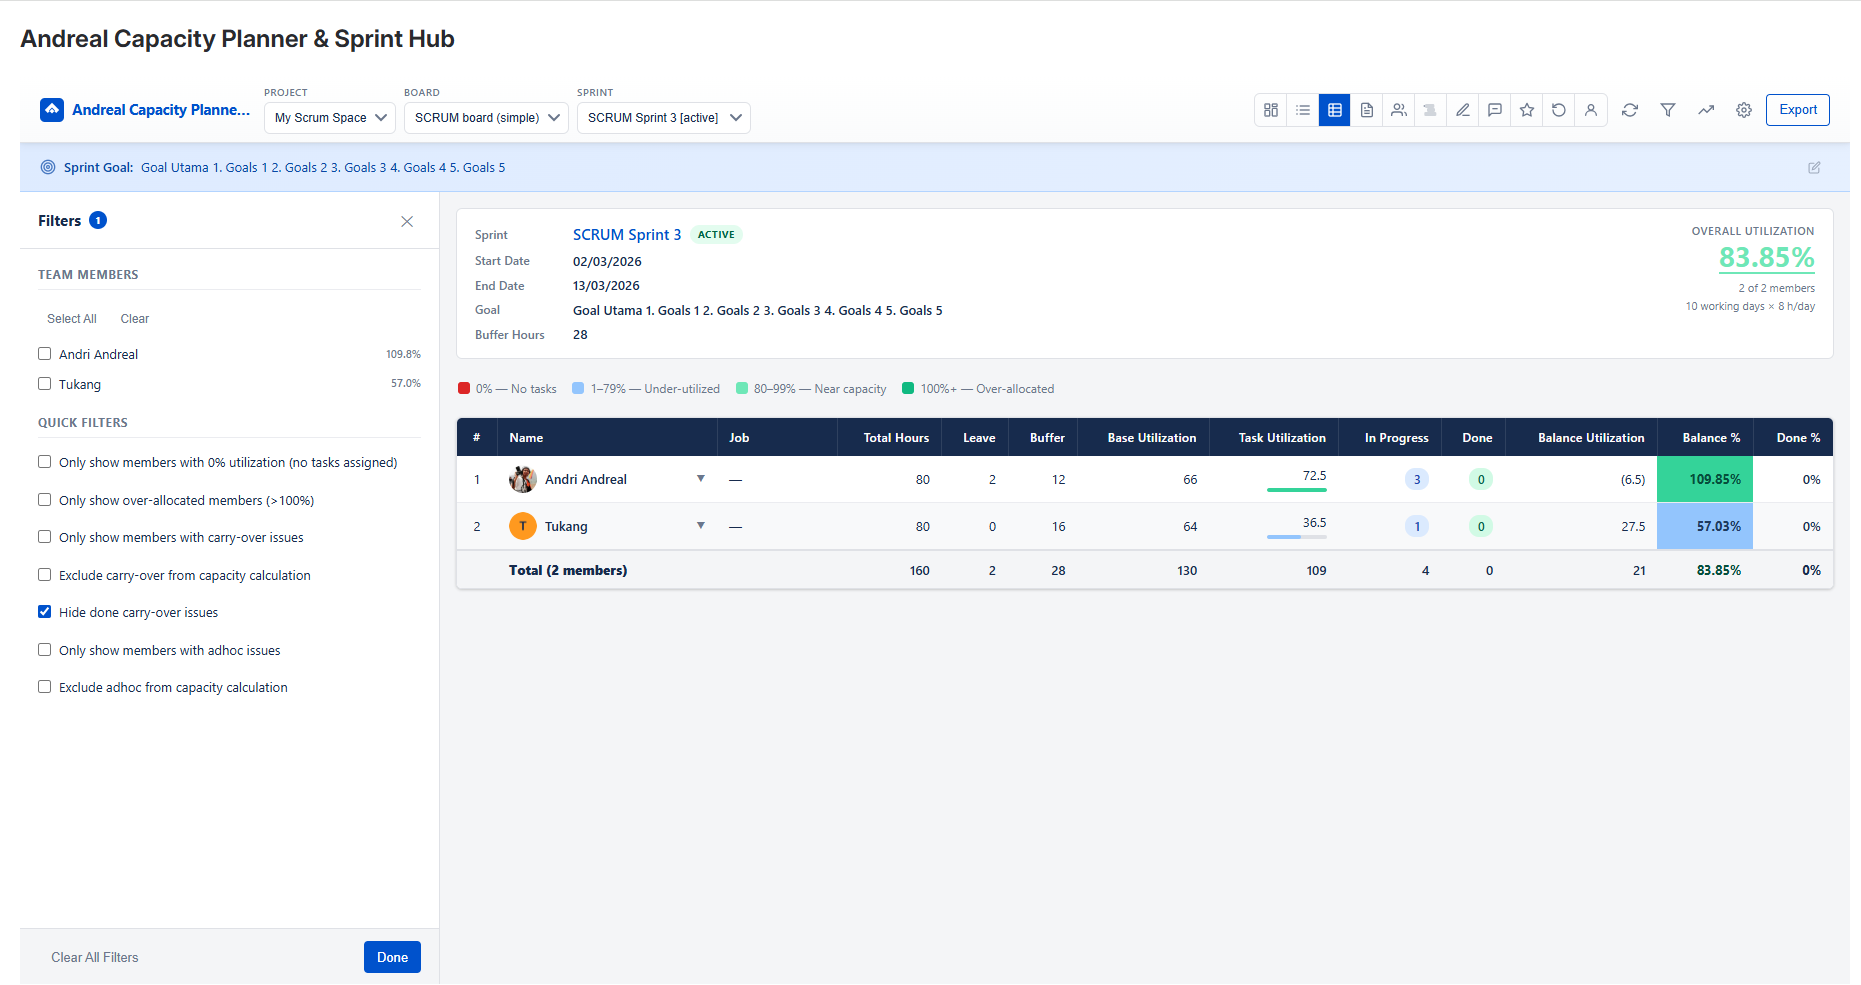
📋 Capacity Table
The core view for sprint planning — see every member's workload, expand to issue level, and spot imbalances instantly.
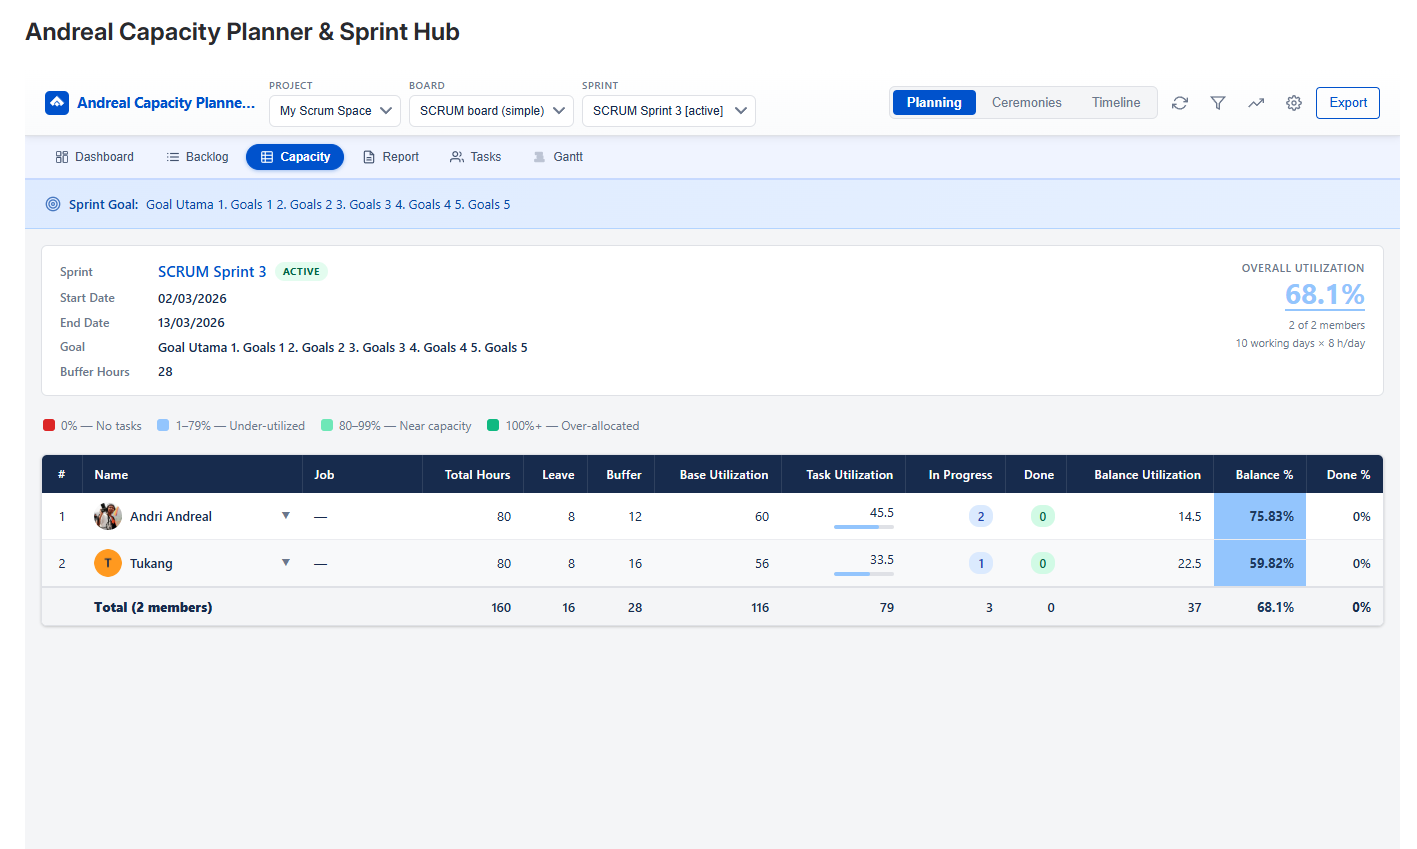
Sprint Summary Header
Above the table, a summary card shows sprint dates, goal, buffer hours, carry-over count, and adhoc count — plus Overall Utilization in the top-right. This gives context before diving into per-member numbers.
Table Columns
| Column | Description |
|---|---|
| # | Row number |
| Name | Member avatar, name, email, and issue count badges (CO carry-over, AD adhoc). Arrow indicates sort order. |
| Job | Job title / role (if set in Jira profile) |
| Total Hours | Total sprint hours = Working Days × Hours/Day × Alloc% |
| Leave | Configured leave hours for this member |
| Buffer | Configured buffer hours |
| Base Utilization | Available hours = Total − Leave − Buffer |
| Task Utilization | Sum of original estimates. Mini progress bar shows In Progress (blue) and Done (green) portions. |
| In Progress | Estimated hours currently in-progress |
| Done | Estimated hours completed |
| Balance Utilization | Task − Done (remaining planned work) |
| Balance % | Task ÷ Base × 100. Color-coded (red/blue/light-green/green) |
| Done % | Done ÷ Task × 100 |
Expanding Issue Rows
Click any member row to expand it and see all assigned issues. The expanded view shows:
- Issue key (clickable — opens in Jira), summary, type, priority, status
- Tags: CO carry-over, AD date adhoc (with date added)
- Original Estimate, Time Spent, and Remaining hours
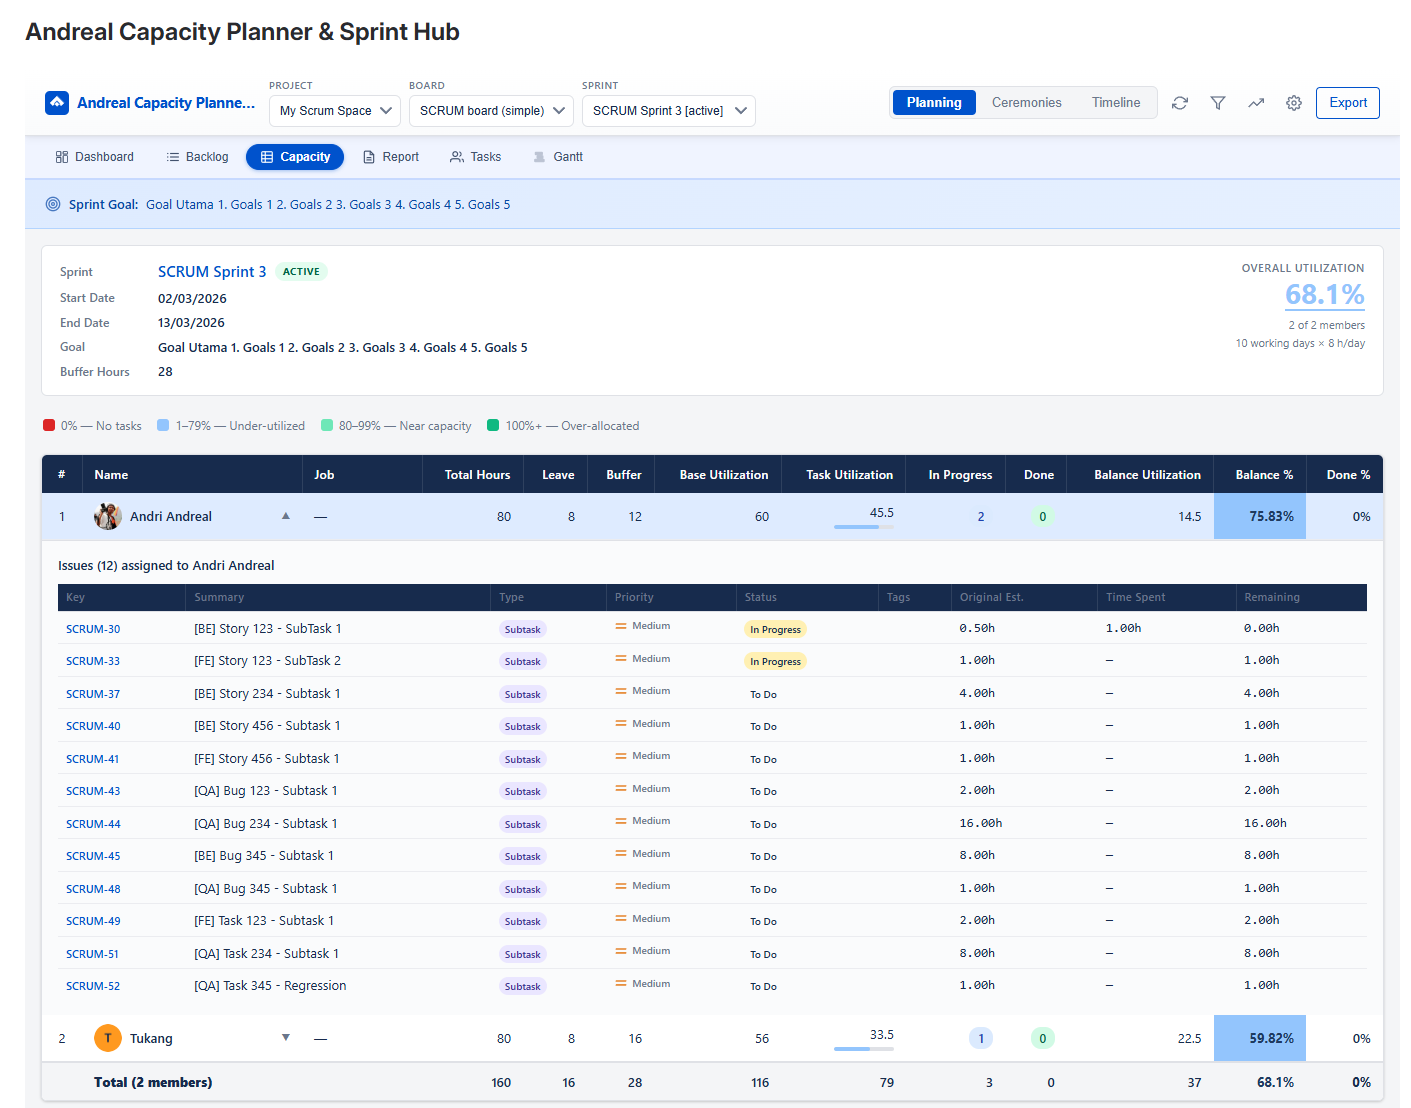
Expanded member row showing individual issues with CO/AD tags, estimates, and time spent
Issue Sub-filters
When a member is expanded, filter buttons appear: All · Carry Over · CO Open · CO Done · Adhoc · New. These help you quickly focus on specific issue types without closing the row.
📝 Sprint Backlog
Full backlog grouped by parent story — ideal for sprint execution tracking and mid-sprint scope checks.
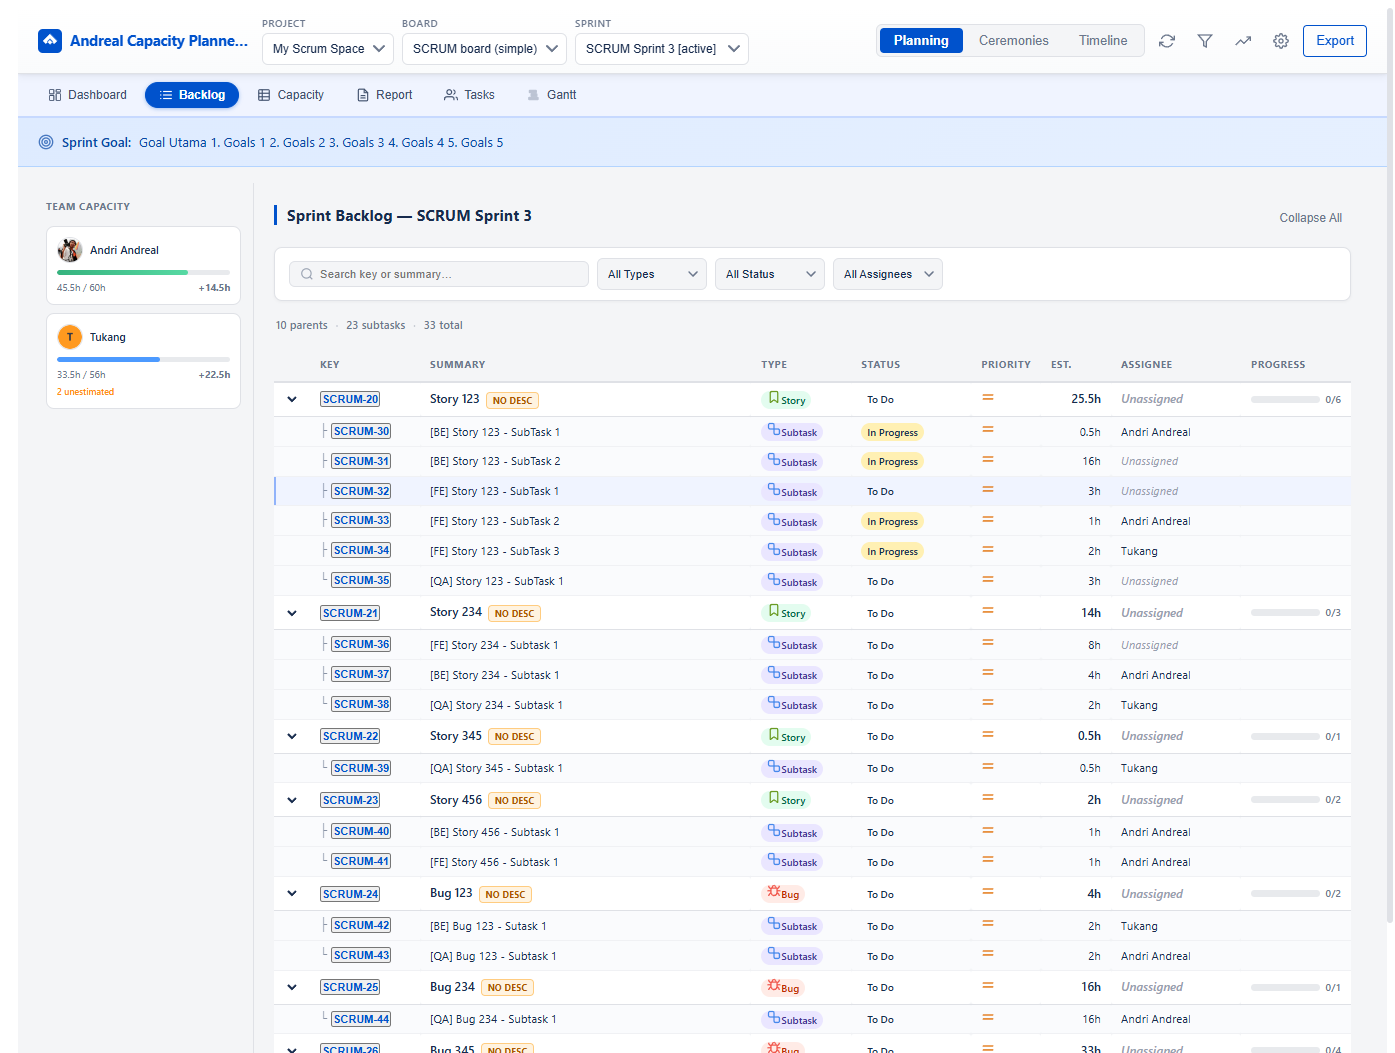
Team Capacity Sidebar
The left sidebar shows a compact capacity summary per member with a color bar. Hover to see exact numbers. This lets you reference capacity while scanning the backlog — useful during planning when deciding who to assign work to.
- Green bar = at or near capacity (80–100%+)
- Blue bar = under-utilized (<80%)
- Number in bold = assigned hours vs base hours
- +/- number shows over or under allocation in hours
Issue Grouping
Issues are grouped by parent story/epic. Each group shows:
- Parent issue key and summary
- NO DESC badge if the parent has no description
- Progress indicator: X/Y subtasks done
- Total estimated hours for the group
Filtering
- Search — search by key or summary text
- All Types — Story, Bug, Task, Subtask
- All Status — To Do, In Progress, Done
- All Assignees — filter to one team member
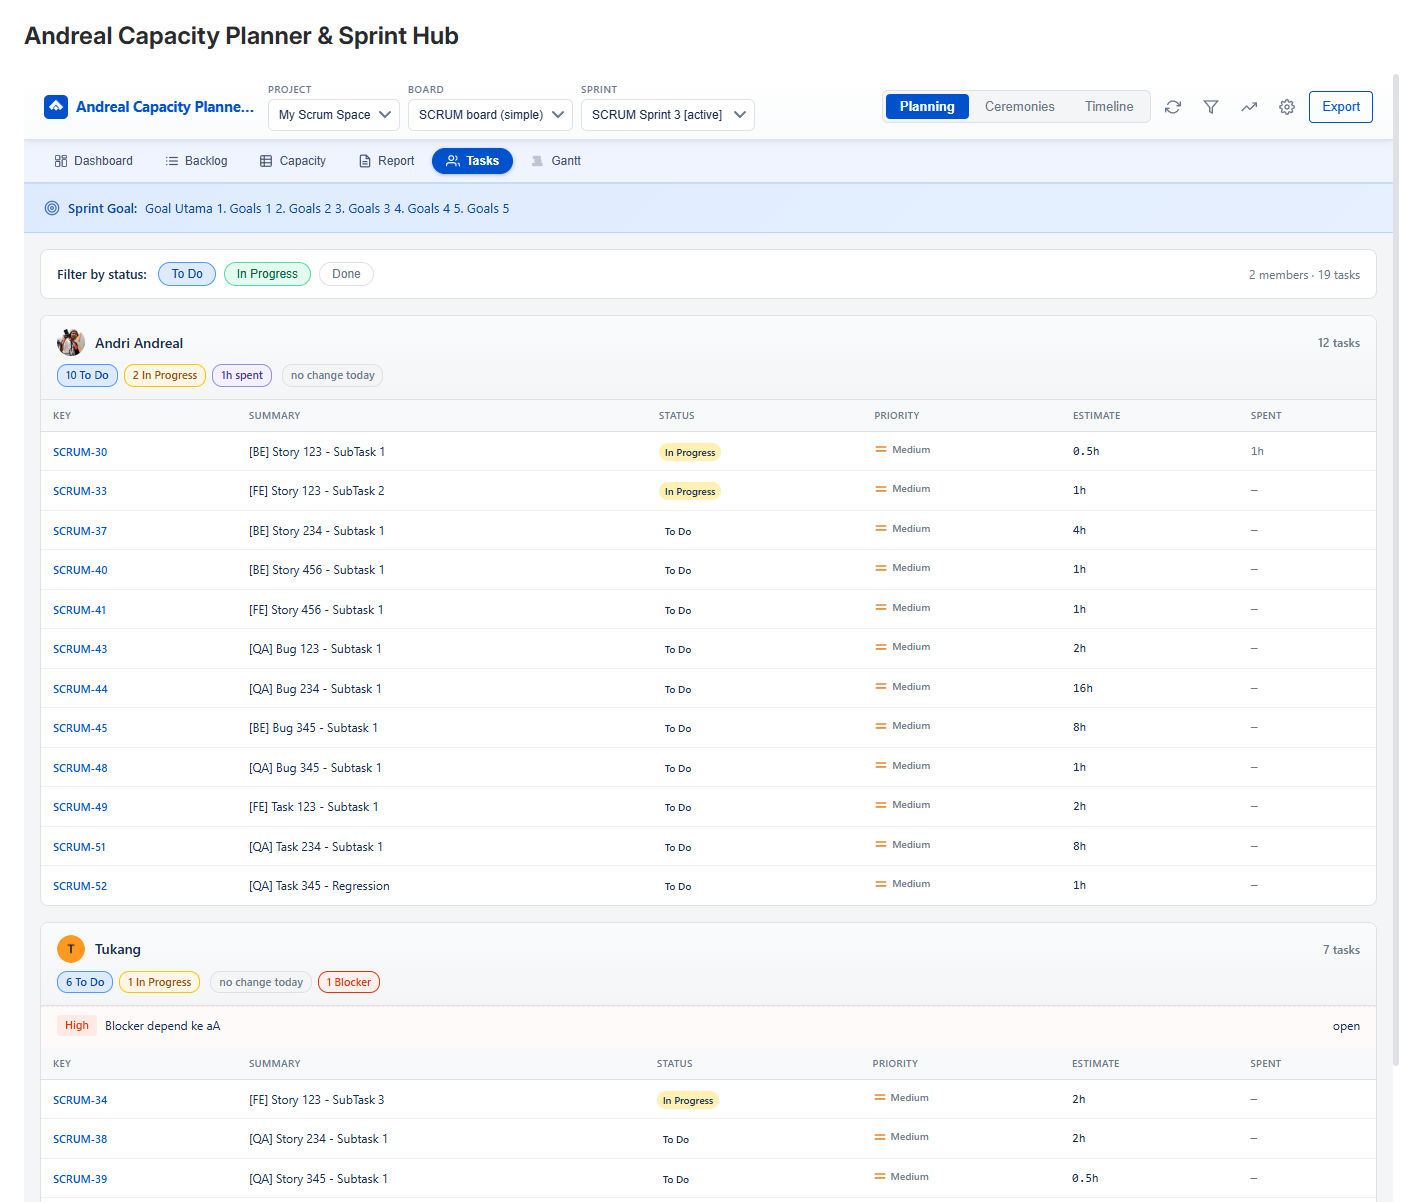
👥 Member Tasks
Quick view of who's working on what, filterable by status.
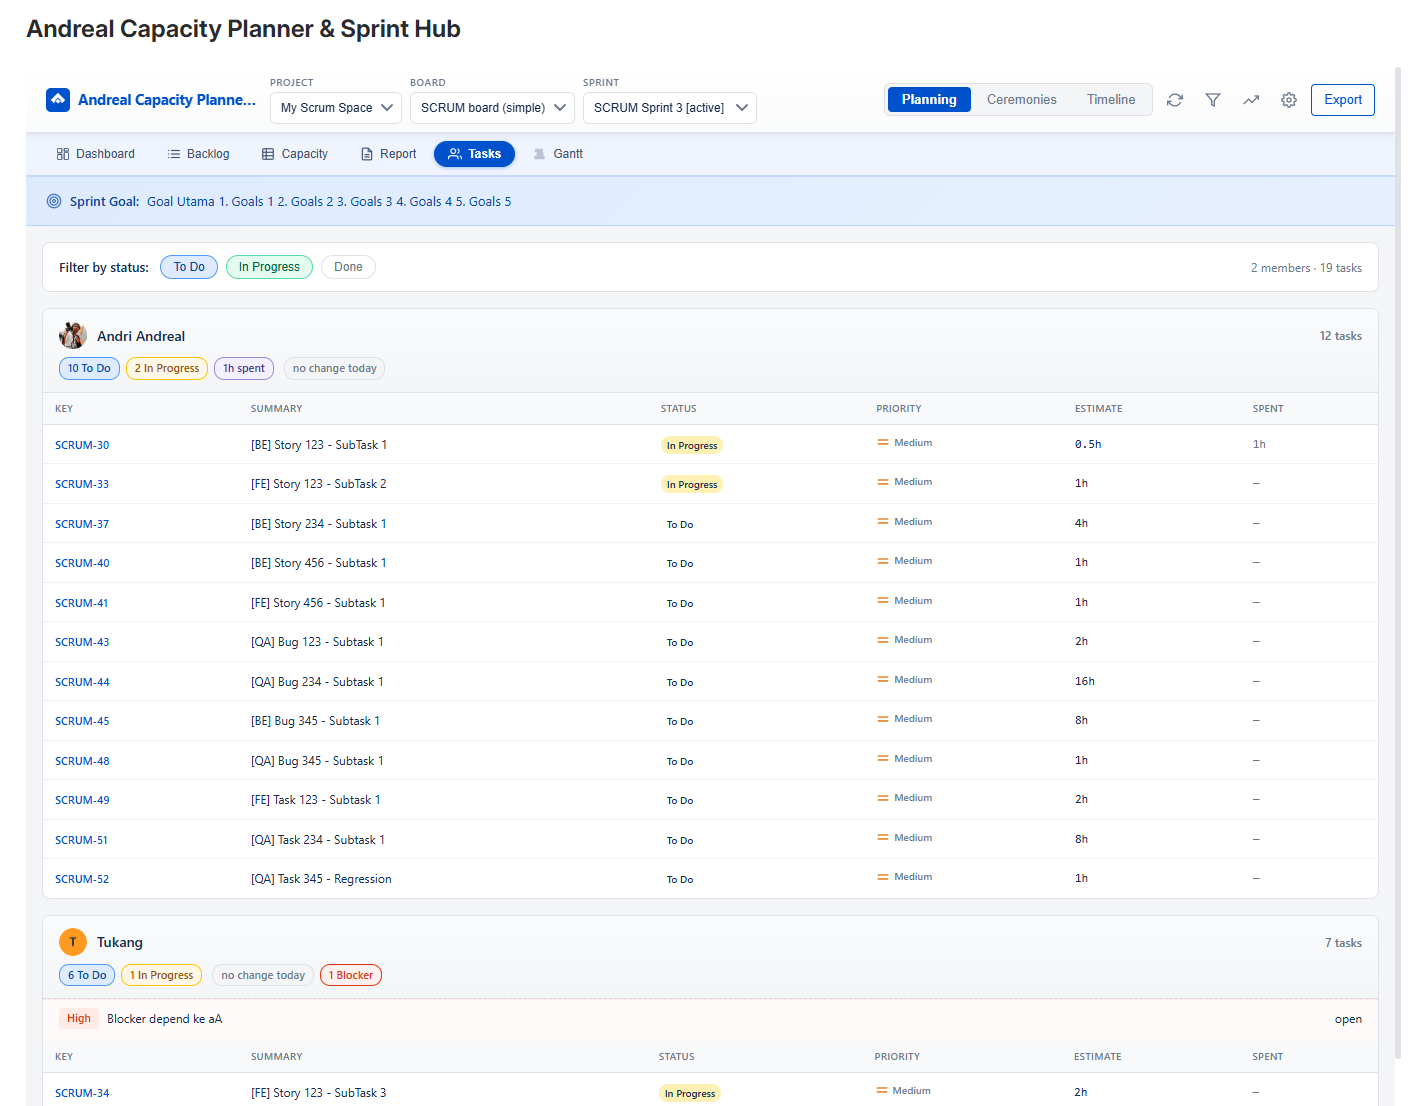
Filter by status tab — To Do, In Progress, Done — to see tasks in that state across all members. The member count and task count update based on the active filter.
Each member card shows:
- Avatar and name
- Task count in the selected status
- List of issues: key, summary, priority icon, estimate
This view is ideal for the Scrum Master to quickly scan who has in-progress work before a daily standup, or to identify members with no in-progress tasks who might be blocked.
👤 My Sprint
Personal view — your own capacity and task list for the current sprint. Each team member sees only their own data here.
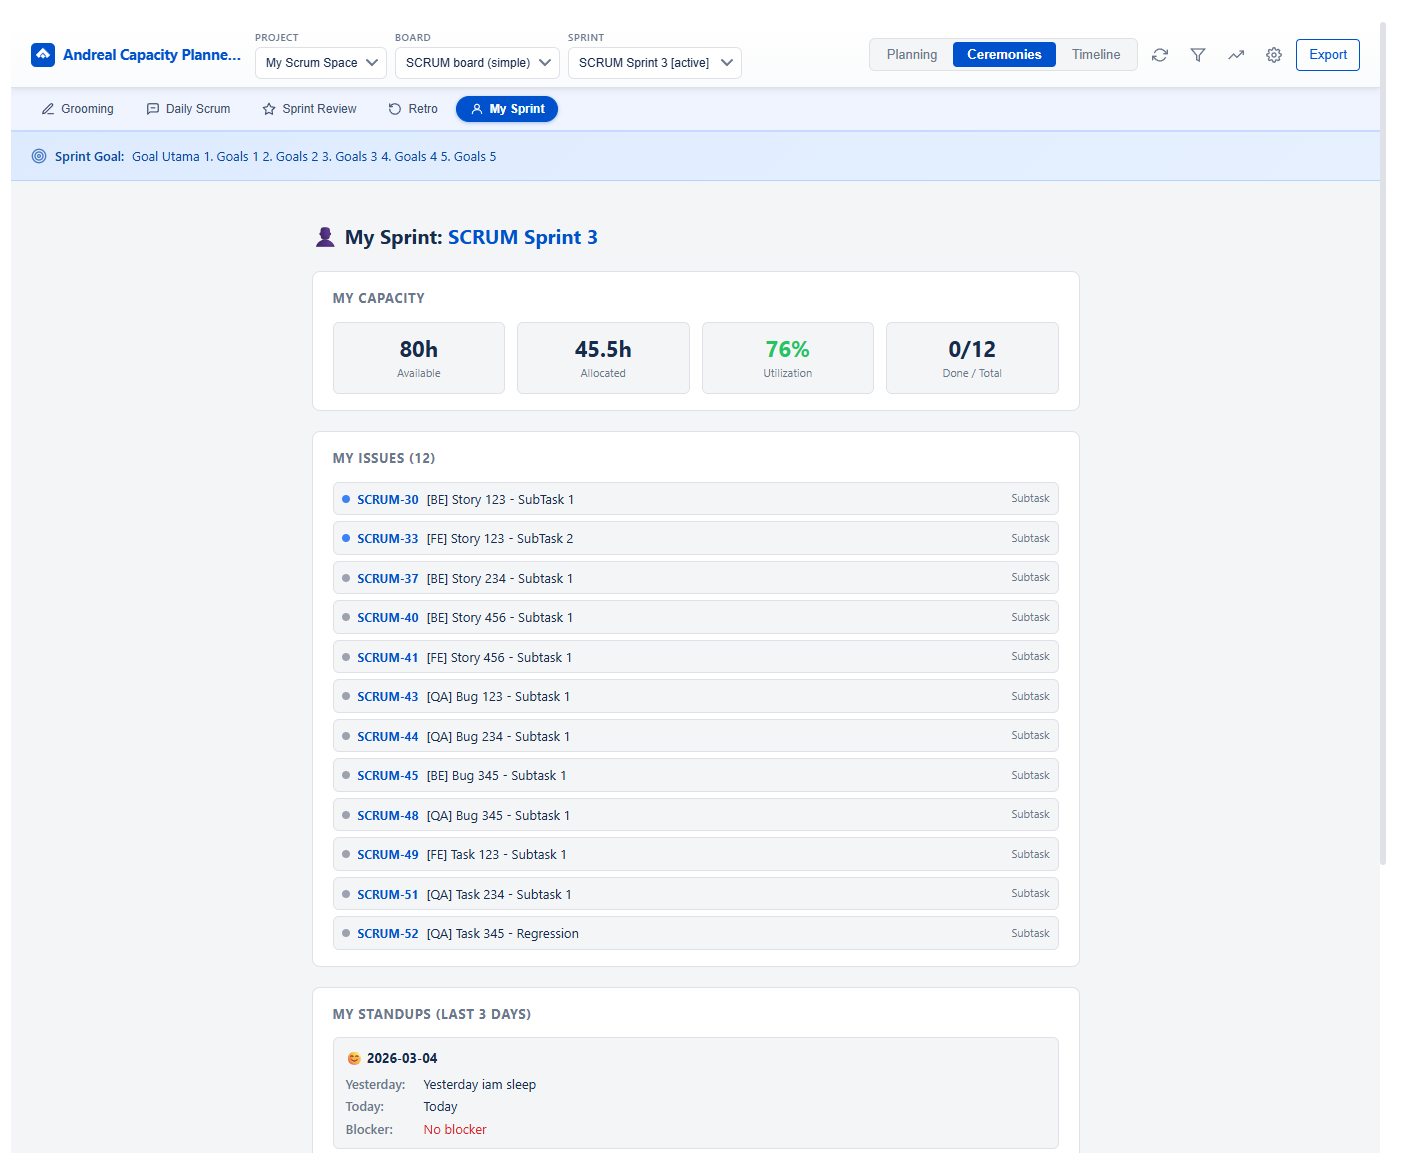
My Capacity Cards
| Card | Description |
|---|---|
| Available | Your base hours (Total − Leave − Buffer) |
| Allocated | Sum of estimates assigned to you |
| Utilization % | Allocated ÷ Available × 100 — color-coded green/blue/red |
| Done / Total | How many of your tasks are done vs total assigned |
My Issues
Complete list of all issues assigned to you in the current sprint. Each issue shows:
- Issue key (links to Jira), summary, issue type
- Status indicator dot (blue = in progress, gray = to do, green = done)
📅 Gantt Chart
Time tracking visualization — see exactly when each member logged work on which issue across the sprint timeline.
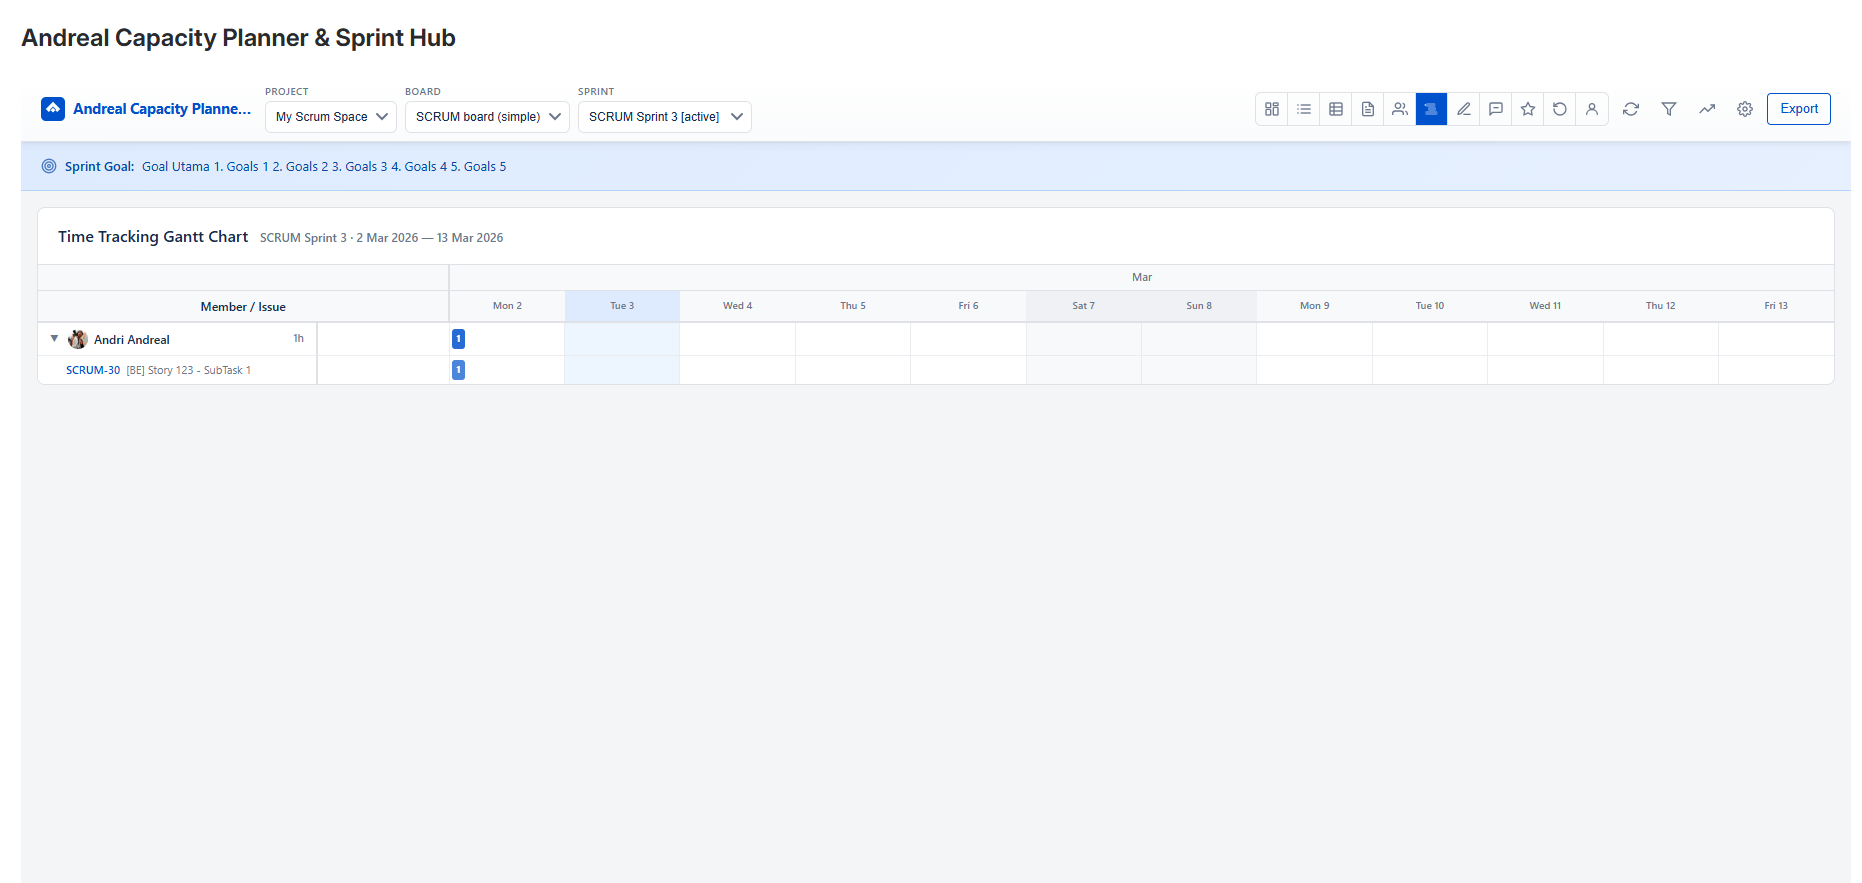
Reading the Chart
- Rows — each member has a header row (collapsible) and child rows for each issue with logged work
- Columns — each column = one sprint day (Mon–Sun)
- Bars — a blue block on a day means work was logged on that issue that day. The number inside = hours logged.
- Today — current date column is highlighted in light blue
- Weekends — shown in gray background
Tooltips
Hover over any worklog bar to see the worklog description, exact hours, and the date — pulled directly from Jira worklogs.
Use Cases
- Identify days when the team was not logging work (possible absence or forgotten logs)
- See if members are working on tasks in parallel (same day, multiple issue rows)
- Correlate task completion dates with estimate vs actual in Sprint History
📑 Sprint History
Deep-dive variance analysis — estimated vs actual hours with worklog descriptions and blocker tracking.
Header Summary
Shows overall utilization, member count, and total issue count for quick reference before diving into details.
Impediments / Blockers Section
At the top, all logged blockers are listed with:
- Description, Reporter, Assignee
- Priority badge (High, Medium, Low)
- Status: open, in progress, resolved
Per-Member Variance Analysis
Each member shows their capacity, assigned hours, utilization %, and done count. Below that, each issue with time logged shows:
- Est → Spent (variance) in green if under, red if over
- Work Descriptions section with individual worklog entries: date, author, hours, description
Variance = Spent − Estimated
Positive (+) = over estimate (red)
Negative (-) = under estimate (green)
✍ Grooming Space
Collaborative pre-sprint grooming with planning poker, story linking, PRD tracking, and Definition of Ready.
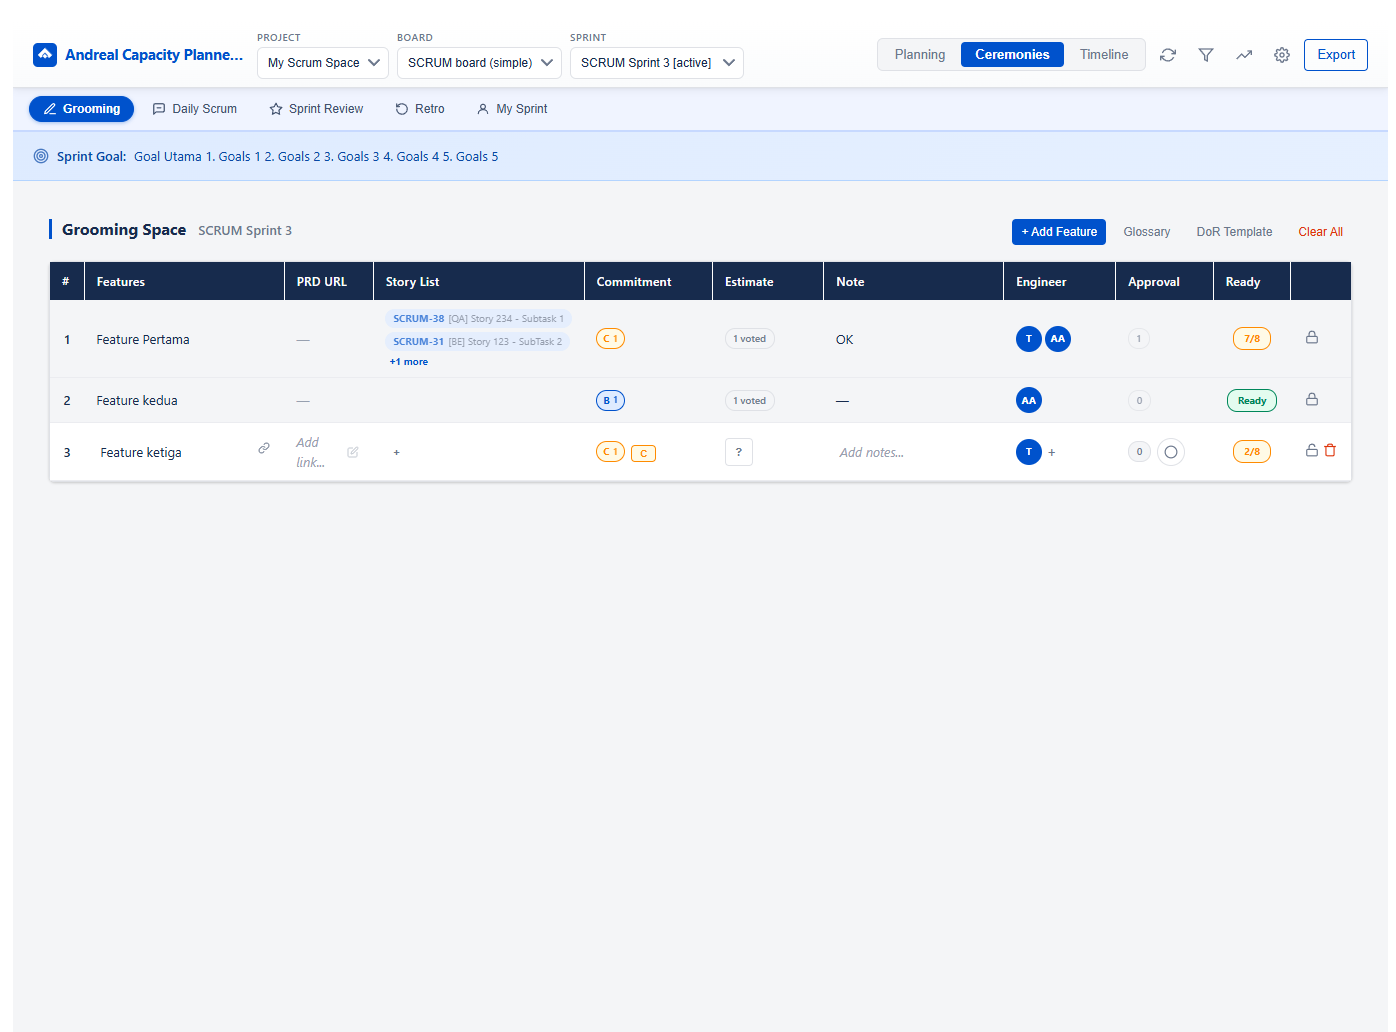
Setting Up a Grooming Session
- Click + Add FeatureAdd each feature or user story that will be groomed in this session.
- Link Jira StoriesType a Jira issue key and press Enter to link it to the feature. Multiple stories can be linked to one feature.
- Add PRD URLPaste the product requirements document URL. Opens in a new tab when clicked.
- Add NotesFree-text notes for the feature — acceptance criteria, questions, decisions.
- Assign EngineerTag one or more engineers responsible. Click + to add members.
Planning Poker
Each feature has a voting area showing member avatars. The flow:
- Each member clicks their estimate card (1, 2, 3, 5, 8, 13, 21, ?) — votes are hidden until revealed
- Facilitator clicks Reveal — all votes show simultaneously
- If votes diverge, team discusses and re-votes
- Facilitator sets the final agreed estimate
Readiness Status
Each feature shows a readiness badge: Ready or X/8 (X of 8 DoR criteria met). This is calculated from the Definition of Ready template.
Glossary & DoR Template
- Glossary — define team-specific terms that appear in stories. All team members see the same glossary during grooming.
- DoR Template — set your Definition of Ready criteria. These checklist items apply to every feature. When a feature meets all criteria, it auto-marks as Ready.
Lock & Commitment
The Commitment column shows which sprint this feature is committed for (C1, C2, etc.) and approval status. Use Clear All to reset the session at the start of a new grooming.
💬 Daily Scrum
Structured standup check-in with mood tracking, team updates table, and focus-of-the-day — per sprint day.
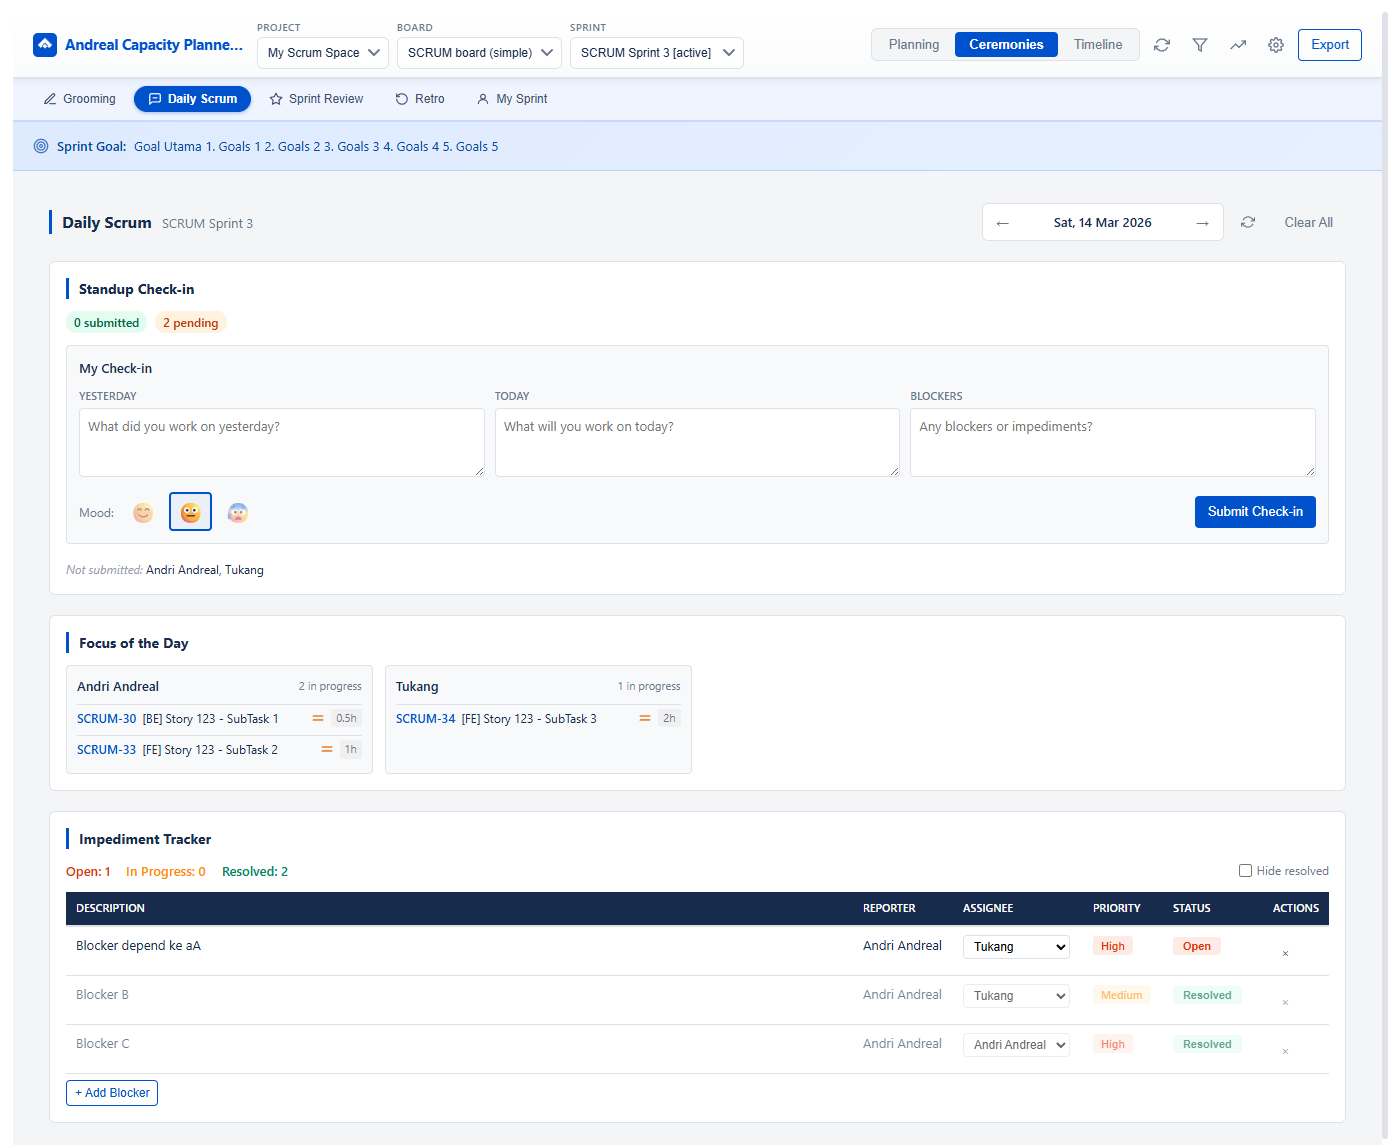
Submitting Your Check-in
- Fill in the three fieldsYesterday — what did you complete? Today — what's your plan? Blockers — anything blocking you?
- Select your mood😀 (great) → 😐 (neutral) → 😨 (stressed). Mood is visible to the whole team.
- Click Update Check-inYour check-in is saved and immediately visible to other team members.
Team Updates Table
Shows all submitted check-ins for the day: member name, yesterday summary, today plan, blockers, mood emoji, and submission time. Members who haven't submitted appear as "Not submitted" at the bottom.
Focus of the Day
Automatically populated from Jira — shows each member's currently In Progress issues with estimated hours. Updates in real-time when the sprint data is refreshed.
Navigating Days
Use ← → arrows to navigate to previous or future days within the sprint. Check-ins are stored per day, so you can review what the team said on any sprint day.
⭐ Sprint Review
Structured sprint review — goal achievement, committed vs delivered metrics, and demo checklist for stakeholder presentations.
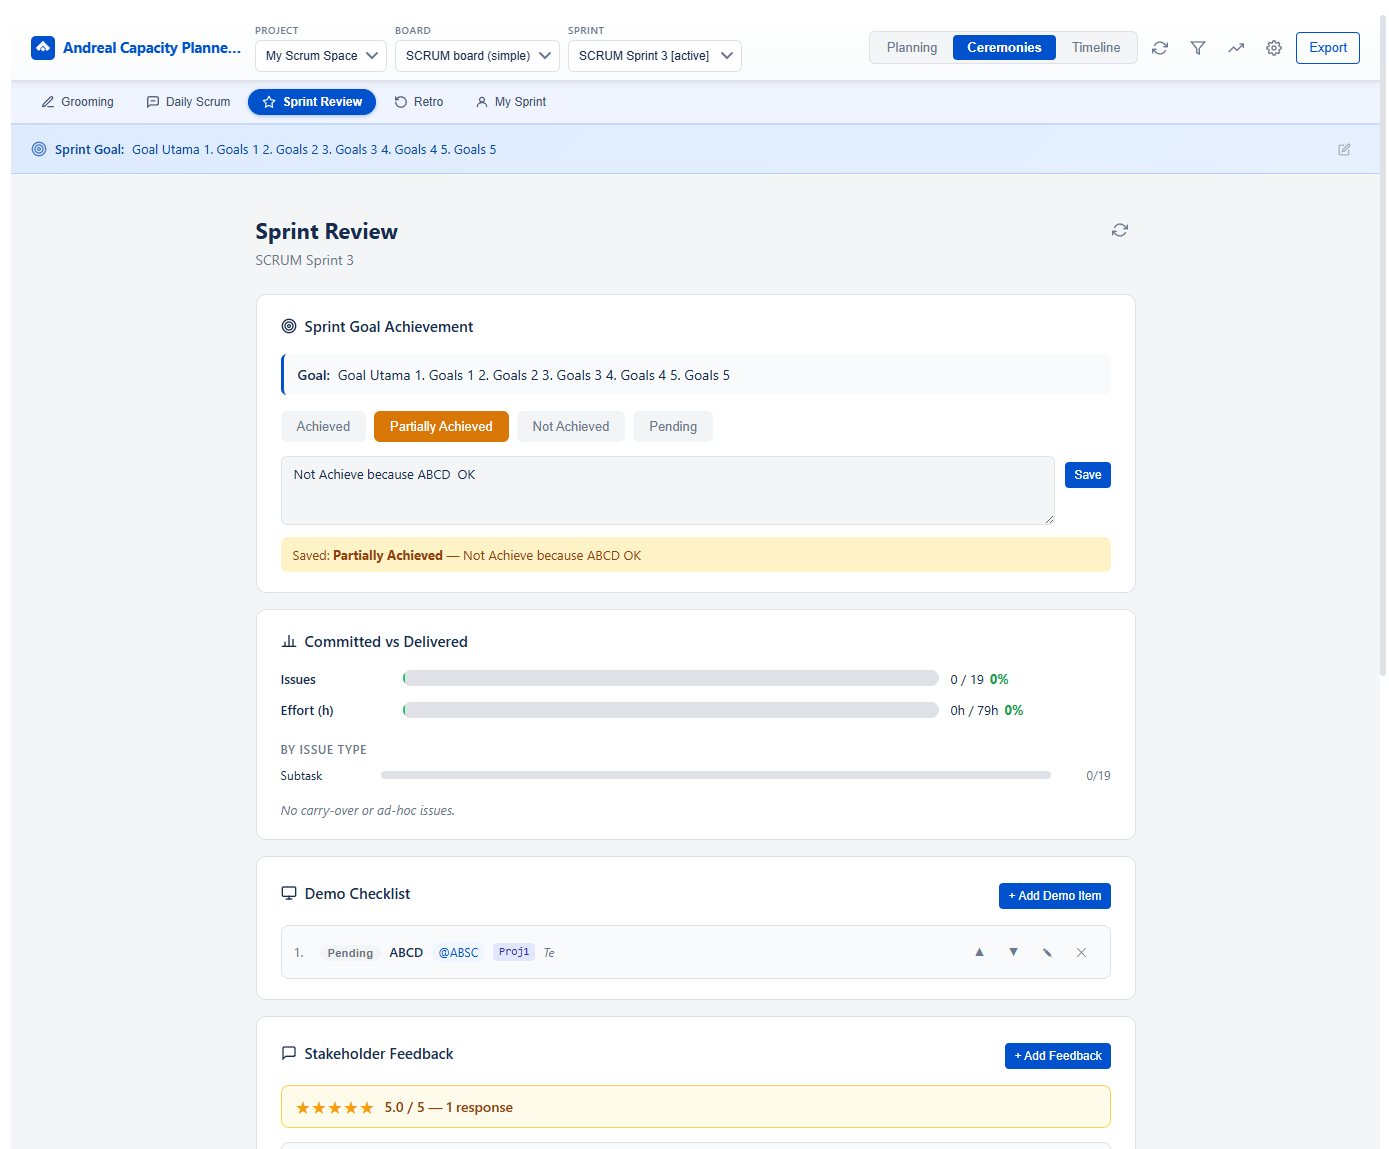
Sprint Goal Achievement
Select the outcome: Achieved / Partially Achieved / Not Achieved / Pending. Add notes to explain context — these are saved and visible to anyone with access.
Committed vs Delivered
Auto-calculated from Jira data at the time of review:
| Metric | Description |
|---|---|
| Issues | X / Y issues completed — shown as a progress bar with % |
| Effort (h) | Actual hours logged vs total estimated hours |
| By Issue Type | Breakdown by Subtask, Story, Bug, Task separately |
| Carry-Over note | Notes any carry-over or adhoc issues that affected delivery |
Demo Checklist
Before the review meeting, click + Add Demo Item to build your demo agenda. Each item can be checked off during the meeting. Items are saved per sprint — use them as a record of what was demonstrated.
🔄 Retrospective
Built-in retro board with team sentiment, multiple formats, voting modes, and action items — all saved per sprint.
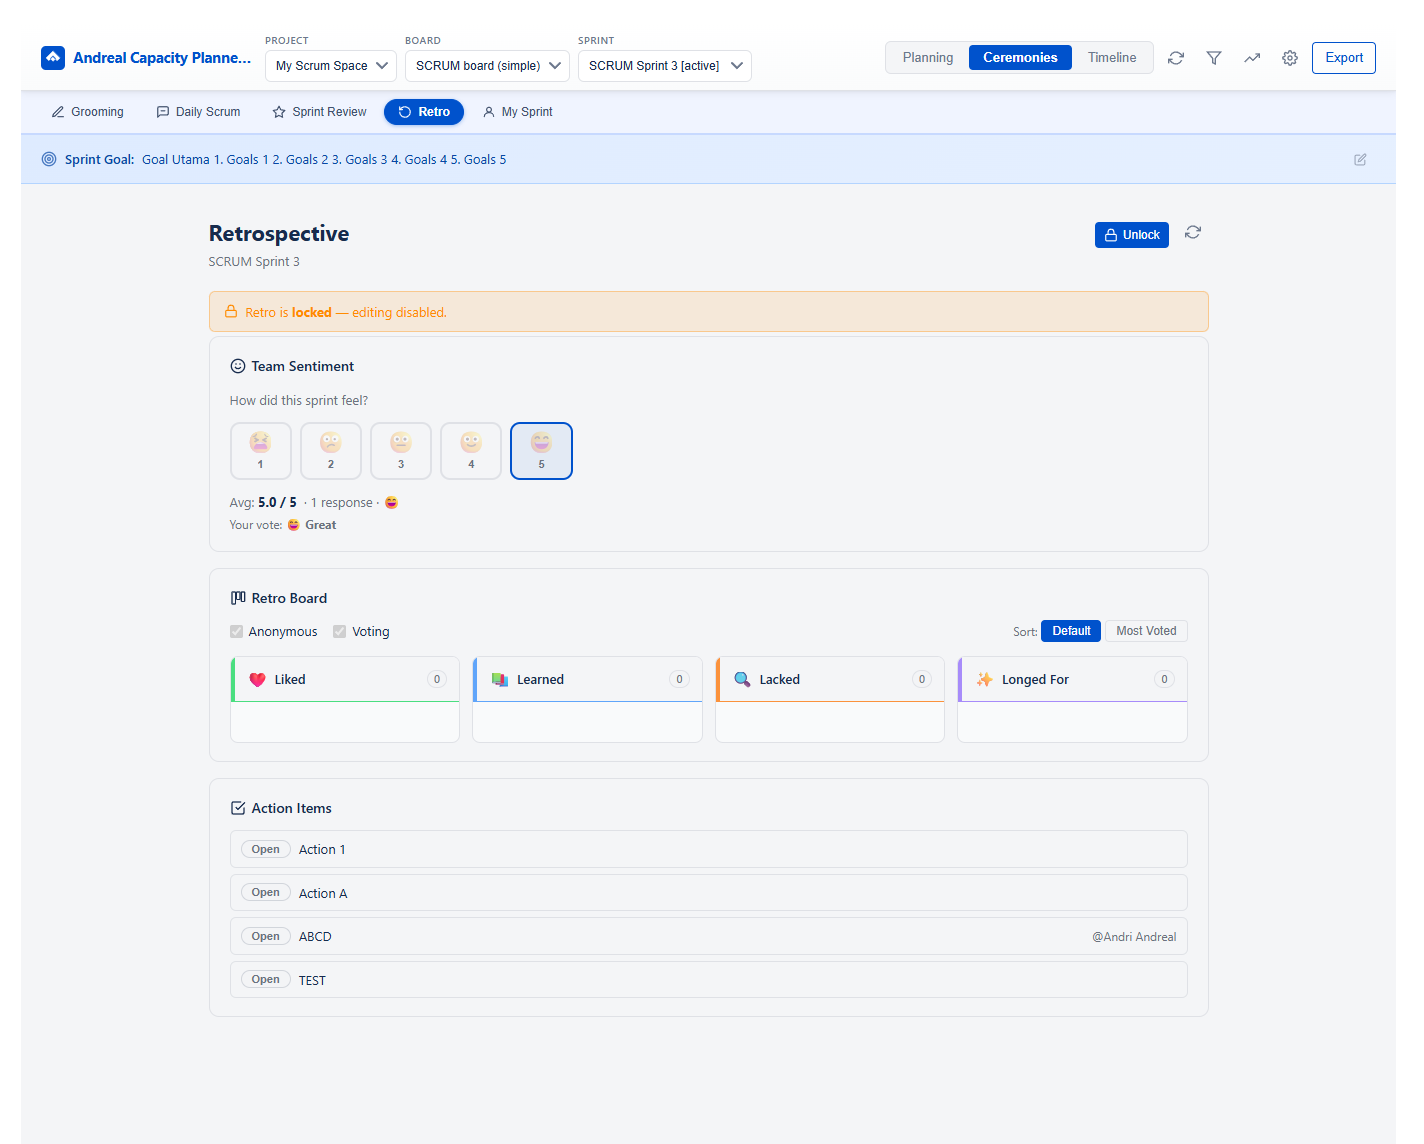
Team Sentiment
Click an emoji (1–5 scale from 😨 to 😍) to rate how the sprint felt. Visible to all team members — use it to open the retro discussion: "I see we have mixed feelings, let's talk about why."
Retro Template
Choose from the dropdown — currently supports Start / Stop / Continue. Cards are organized into three columns:
- Start (green) — things we should start doing
- Stop (red) — things we should stop doing
- Continue (blue) — things that are working well
Board Options
| Option | Effect |
|---|---|
| Anonymous | Hides author names on all cards. Encourages honest feedback without social pressure. |
| Voting | Each member can upvote cards. Sort by Most Voted to prioritize discussion time on the most important topics. |
| Lock 🔒 | Prevents adding or editing cards. Use after the retro is complete to preserve the record. |
Action Items
After discussion, add concrete follow-up tasks by clicking + Add Action Item. Each action item has:
- Description of the action
- Status: Open or Done
Review open action items from the previous sprint's retro at the start of the next sprint's retrospective.
📅 Monthly Planning
See all sprints within a month in one consolidated view — track team performance trends across the full month.
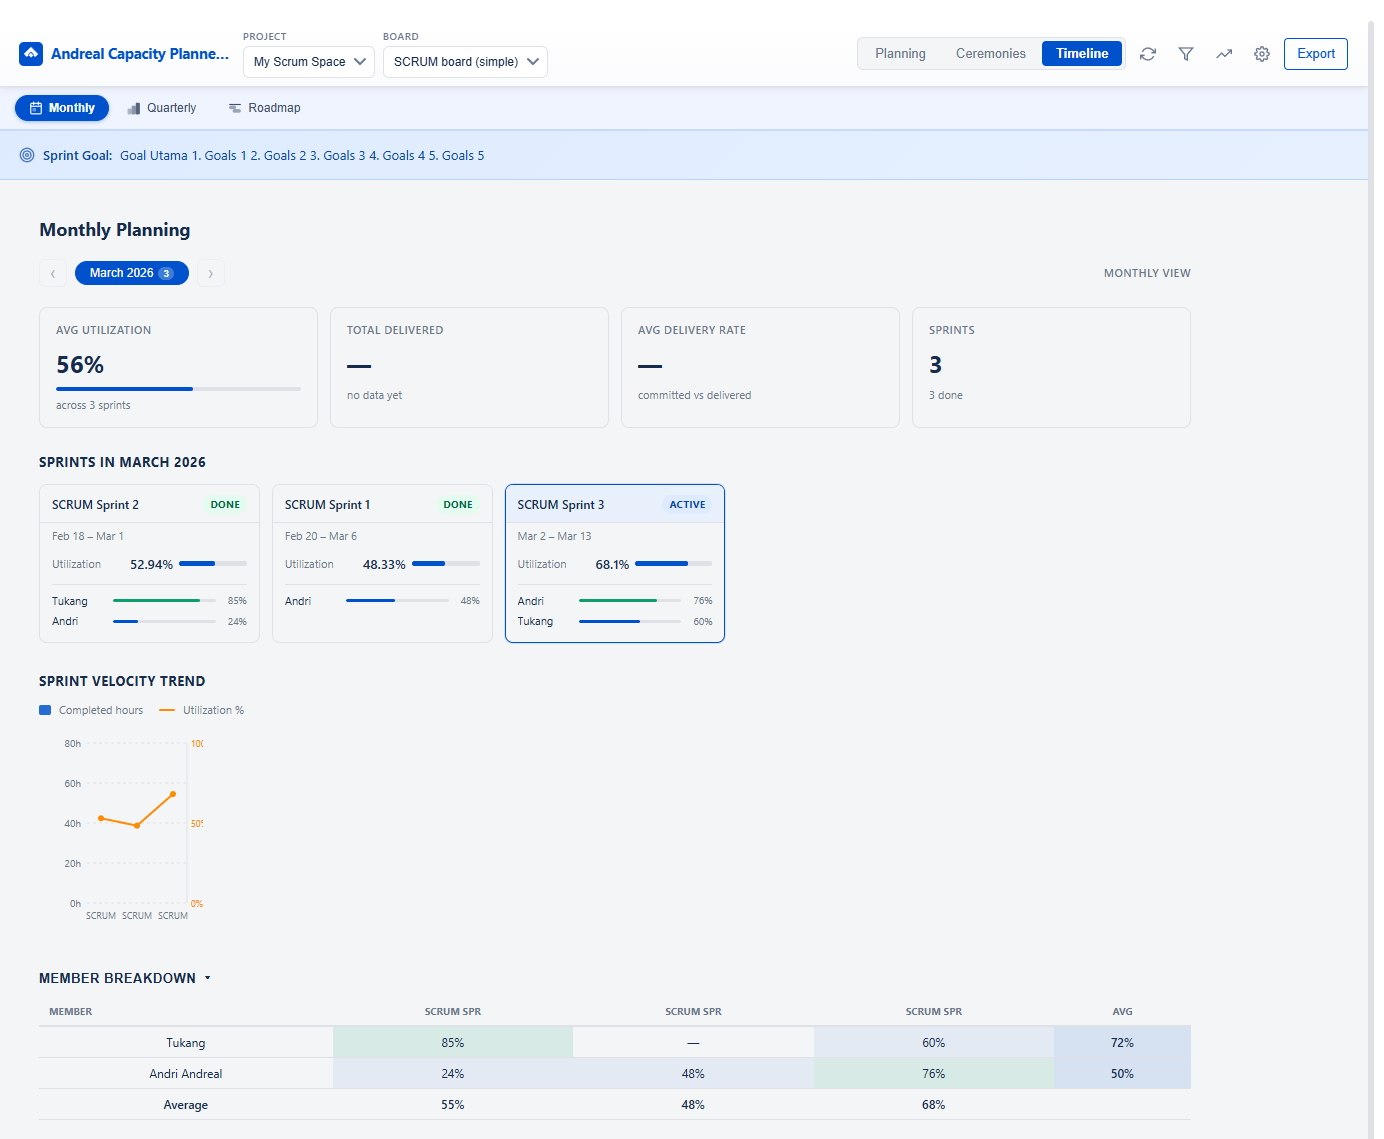
Monthly Planning — sprint cards, velocity trend chart, member breakdown table
Navigating Months
Use the ← → arrows next to the month badge (e.g. March 2026) to navigate between months. The badge shows the number of sprints found in that month.
Summary Cards
| Card | Description |
|---|---|
| Avg Utilization | Average Balance % across all sprints in the month |
| Total Delivered | Sum of delivered story points or hours across sprints (if data is available) |
| Avg Delivery Rate | Average committed vs delivered ratio across sprints |
| Sprints | Total number of sprints in the period with done count |
Sprint Cards
Each sprint in the month is shown as a card with:
- Sprint name, date range, and status badge (DONE / ACTIVE)
- Overall utilization % with a progress bar
- Per-member utilization bars with % values
The active sprint is highlighted with a blue border.
Sprint Velocity Trend
A dual-axis chart showing Completed Hours (bar) and Utilization % (line) for each sprint in the period. Use this to spot velocity drops or utilization spikes across sprints.
Member Breakdown Table
A cross-sprint table listing each member's utilization % per sprint, with an Avg column on the right. Color-coded cells make it easy to spot outliers — consistently low or high performers across the entire month.
📊 Quarterly Planning
Quarter-by-quarter view of all sprints — ideal for planning reviews, OKR tracking, and cross-sprint performance analysis.
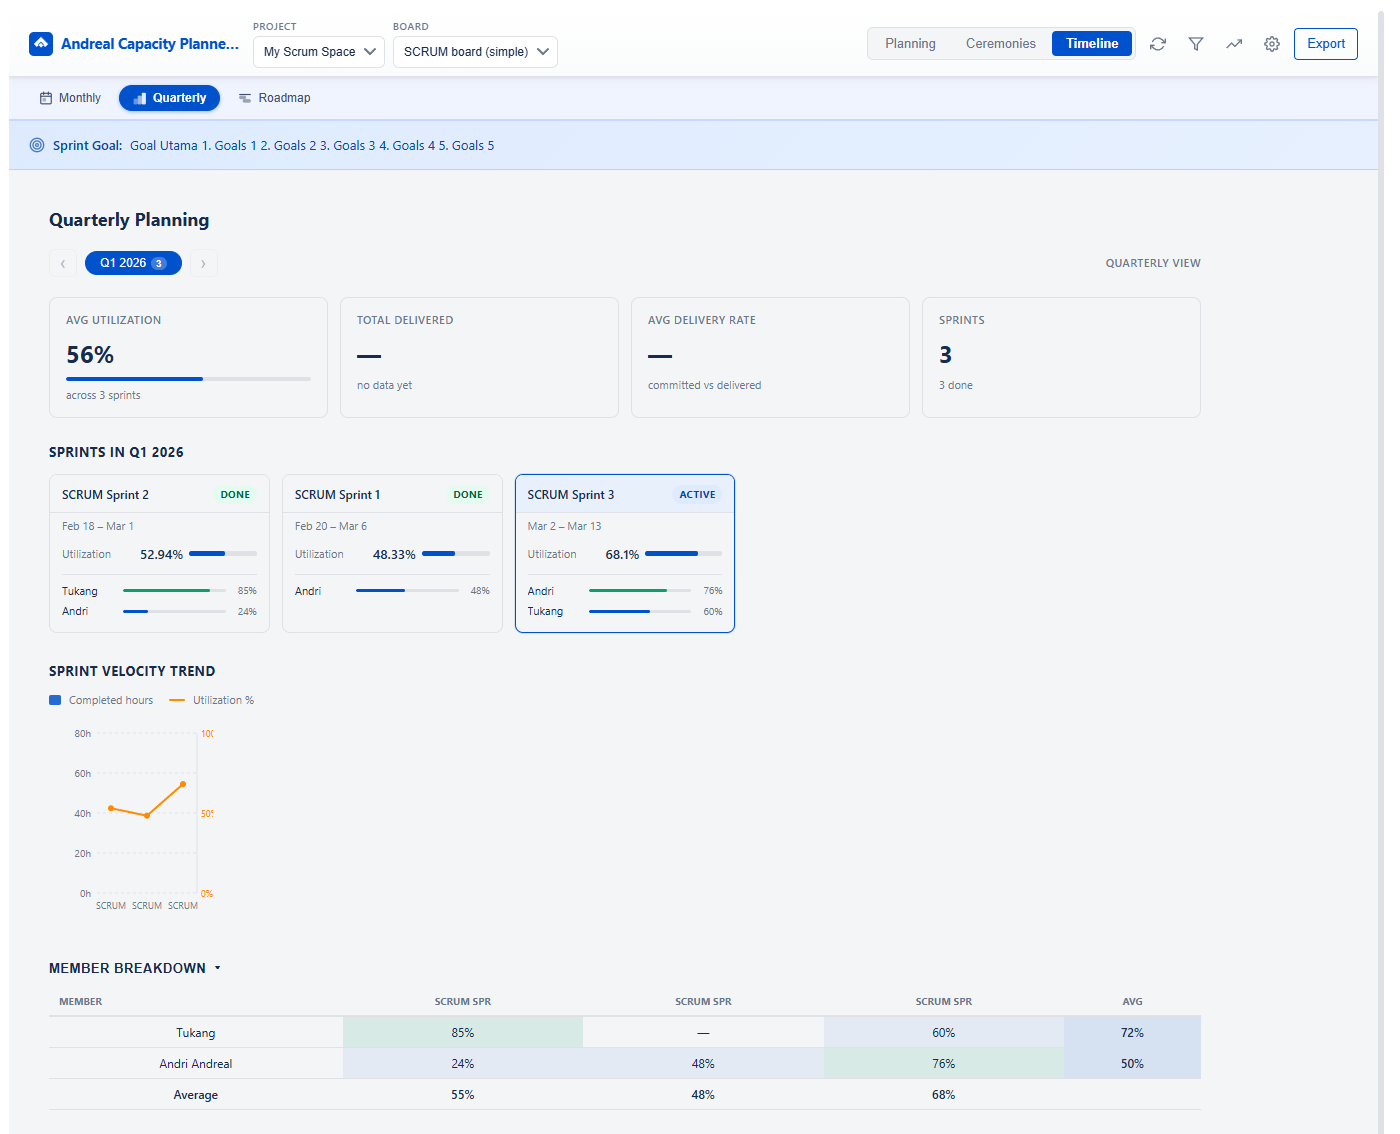
Quarterly Planning — Q1 2026 with sprint cards, velocity trend, member breakdown
Navigating Quarters
Use the ← → arrows next to the quarter badge (e.g. Q1 2026) to move between quarters. The badge shows the count of sprints in that quarter.
The layout is identical to Monthly Planning but grouped by quarter (Q1 = Jan–Mar, Q2 = Apr–Jun, Q3 = Jul–Sep, Q4 = Oct–Dec). This gives a higher-level view suitable for quarterly business reviews.
🗺 Roadmap
Visual Gantt timeline for product roadmap planning — overlay sprints and custom items, drag to adjust dates, and connect items with dependency arrows.
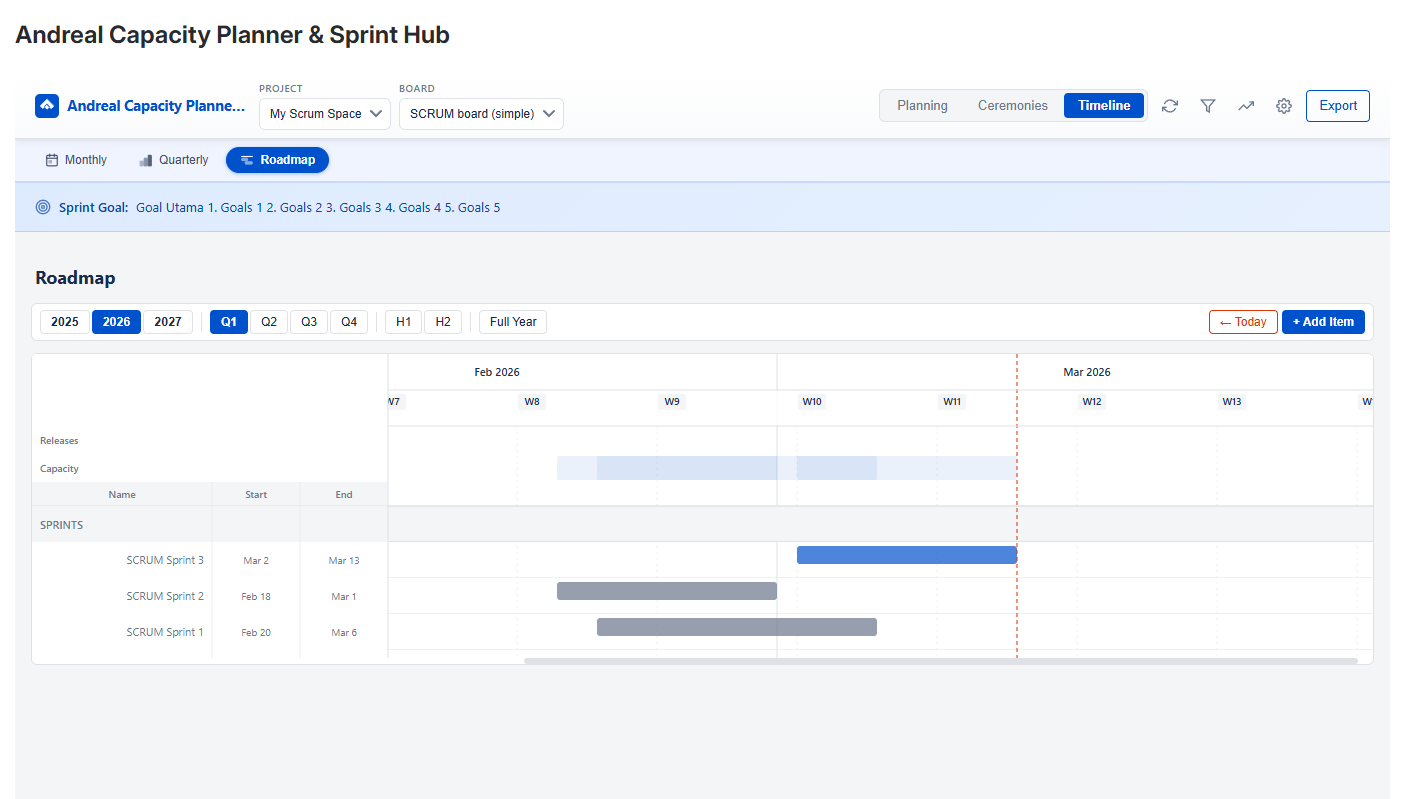
Roadmap — Gantt timeline with sprint bars, roadmap items grouped by category, and dependency indicator
Timeframe Controls
Switch between 2025 / 2026 / 2027 and granularity buttons Q1 Q2 Q3 Q4 / H1 H2 / Full Year. The timeline adjusts to show the selected period. Click ← Today to scroll back to the current date.
Timeline Sections
| Section | Description |
|---|---|
| Releases | Diamond markers for Jira versions/releases on their release date |
| Capacity | Heatmap bars showing sprint utilization % per sprint period |
| Sprints | Sprint bars pulled from Jira — blue = active, gray = closed/future |
| Roadmap Items | Custom items you add, grouped by category with draggable colored bars |
Adding Roadmap Items
- Click + Add ItemOpens a modal form. Fill in Name, Group (optional), Start Date, End Date, Notes, and pick a color.
- Click Add ItemThe item appears as a bar on the Gantt timeline in the ROADMAP ITEMS section.
Editing Items
Click any roadmap item bar to open the Edit modal. You can update all fields including dependencies. To quickly adjust dates, drag the bar left/right (move) or drag the left/right edge (resize).
Dependencies
In the Edit modal, use the Dependencies search field to link this item to one or more predecessor items. After saving, a dependency arrow is drawn from the end of the predecessor bar to the start of the dependent bar.
You can also set dependencies directly from the label column — click the + add dependency or ↩ predecessor name text below any item name to open the inline dependency picker.
Groups
Items with the same Group name are visually grouped together under a labeled header row. Use groups to organize items by team, product area, or initiative (e.g. "Backend", "Mobile", "Design").
🔁 Carry-Over & Adhoc Detection
How the app automatically identifies unplanned and incomplete work.
Carry-Over Issues
An issue is flagged as CO carry-over when it appears in both the current sprint AND the previous sprint. This means it wasn't completed in the previous sprint and was carried forward.
Carry-Over = issues in current sprint
WHERE key also in previous sprint issues
- CO Open — carry-over issue still not done
- CO Done — carry-over issue completed this sprint
Adhoc Issues
An issue is flagged as AD adhoc when it was added to the sprint after the sprint start date. The app checks the Jira issue changelog for the "Sprint" field change timestamp.
Adhoc = issues WHERE sprint_field_changed_date > sprint.startDate
The adhoc badge shows the date the issue was added (e.g. AD 20 Feb) — useful for spotting when scope creep occurred.
Impact on Capacity
By default, carry-over and adhoc hours are included in Task Utilization. Use the Smart Filters to exclude them and see what the "clean" sprint capacity looks like:
- "Exclude carry-over from calculation" — removes CO hours from Balance %
- "Exclude adhoc from calculation" — removes AD hours from Balance %
🔍 Smart Filters
Narrow the Capacity Table to focus on specific members or issue patterns.
Team Members Filter
Check/uncheck members to show only those rows in the Capacity Table. Utilization % is shown next to each name for quick reference. Use Select All / Clear buttons to quickly toggle.
Quick Filters
| Filter | Use Case |
|---|---|
| Only 0% utilization | Find members with no tasks — assign work or investigate absence |
| Only over-allocated (>100%) | Identify members at risk of overload before sprint starts |
| Only with carry-over | Review who has carry-over baggage from last sprint |
| Exclude carry-over from calculation | See "true" planned capacity without legacy work |
| Hide done carry-over | Only show carry-over that still needs attention |
| Only with adhoc | Show members who received unplanned work mid-sprint |
| Exclude adhoc from calculation | See capacity as originally planned vs what was added |
Active filter count appears on the filter icon badge. Click Done to apply or Clear All Filters to reset.
📄 Export
Export the Capacity Table in multiple formats for reporting and archiving.
Click Export in the top-right corner of the toolbar. A dropdown lets you choose the format.
| Format | Best for | What's included |
|---|---|---|
| Sharing in Slack, email, or printing for meetings | Color-coded capacity table per member, sprint summary header, color legend | |
| Excel (.xlsx) | Further analysis, building reports, pivot tables | Formatted worksheets: summary sheet + per-member detail with all columns |
| CSV | Importing into other tools (Google Sheets, BI tools) | Raw flat data — one row per member with all numeric columns |
🎨 Color Coding Reference
Balance % colors give instant visual signals about workload — no numbers needed at a glance.
| Color | Balance % | Meaning | Recommended Action |
|---|---|---|---|
| Red | 0% | No tasks assigned — member is idle | Assign work or mark as unavailable in config |
| Blue | 1–79% | Under-utilized — has remaining capacity | Consider assigning more work or reducing buffer hours |
| Light Green | 80–99% | Near capacity — well balanced | Ideal zone — no action needed |
| Green | 100%+ | At or over capacity | Review if work is realistic; risk of burnout if significantly over 110% |
❓ Frequently Asked Questions
Common questions about setup, behavior, and data.